Time-series models
Time-series models can detect a large amount of data leaving an internal source entity, that is going out to an external destination. Time-series models are created on a user or a device level, and can also be created over peer groups if peer groups exist.
The model creates a baseline per user or per device for a daily and weekly window. The model flags if the amount of outgoing bytes is greater than the baseline gaussian mean, by a ratio of threshold times the mean. This ratio is configurable. The amount of outgoing bytes must be greater than an absolute threshold, and if peer groups exist, then there is also a peer group baseline and threshold ratio for the peer groups.
The model runs over 30 days, and mines the feature fields in the semiaggr_s cube to detect unusual data transmissions. The semiagger_s data is configurable.
Time-series batch models in Splunk UBA version 5.3.0 include the following enhancements:
- Models now handle different data transferring modes.
- The interpretation of anomalies from the UI displays additional details.
- Performance scalability significantly improved for large-scale deployments.
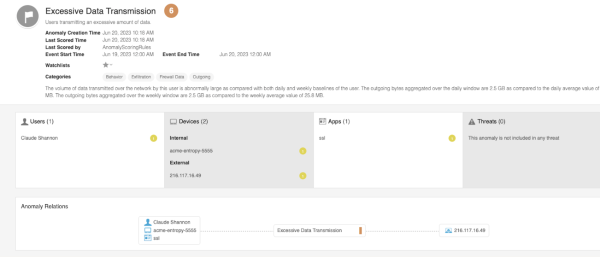
The following image shows how the time-series model might trigger Excessive Data Transmission anomalies to show in your Latest Anomalies paneI:
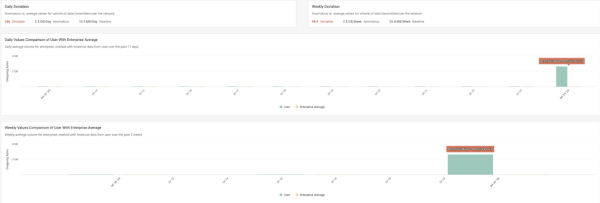
The following image shows a chart you can use to see a comparison of daily volume with the average on daily usage:
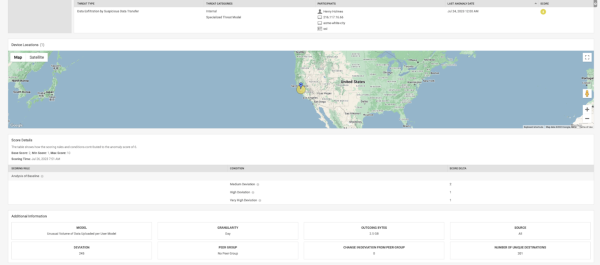
The following image shows how you can check to see if the anomalies are related to any of the detected threats on the Data Exfiltration by Suspicious Data Transfer panel:
Available time-series models
Splunk UBA version 5.4.0 and higher includes the following four time-series batch models for data exfiltration detection:
| Model name | Description | Anomaly type |
|---|---|---|
| Unusual Volume of Data Uploaded per User Model | Detects outliers in the timeseries of outgoing bytes transmission by each user. | BytesTransmitted |
| Unusual Volume of Data per User Model | This model uses network traffic profiling. Detects outliers in the time series of outgoing bytes transmission by each user after profiling network traffic connection. This model only considers connections that behave as file transfers while ignoring other types of connections like regular web browsing and interactive chat/video connections. The purpose of this connection profiling is to reduce instances of false positives (FP).
This profiling feature is only applicable when network events provide information about the number of packets involved. |
BytesTransmitted |
| Unusual Volume of Data Uploaded per Device Model | Detects outliers in the timeseries of outgoing bytes transmission per internal device. | BytesTransmitted |
| Unusual Volume of Data Uploaded per Device Model | This model uses network traffic profiling. Detects outliers in the time series of outgoing bytes transmission by each device after profiling network traffic connection. This model only considers connections that behave as file transfers while ignoring other types of connections like regular web browsing and interactive chat and video connections. The purpose of this connection profiling is to reduce instances of false positives (FP).
This profiling feature is only applicable when network events provide information about the number of packets involved. |
BytesTransmitted |
| Unusual Volume of File Access Related Events per User Model | This model detects outliers in the time-series of the daily count of file related events per user. | MultipleFileOps |
Time-series model examples
The following image shows how the alert appears when there is a high volume of outgoing bytes for a user. Here, the user Claude Shannon has an abnormally high volume of bytes leaving the network compared to the weekly and daily baselines created for this user.
The following image shows an example of an abnormally high amount of outgoing bytes for a device.
The following image shows the daily and weekly baseline values for outgoing bytes compared to the spike shown in green of daily and weekly unusually high outgoing bytes:
The following image shows the location of a user with an unusually high volume of data leaving the network.
| VPN login related anomaly detection models |
This documentation applies to the following versions of Splunk® User Behavior Analytics: 5.4.0, 5.4.1, 5.4.1.1, 5.4.2, 5.4.3


 Download manual
Feedback submitted, thanks!