Example: Troubleshoot a data source
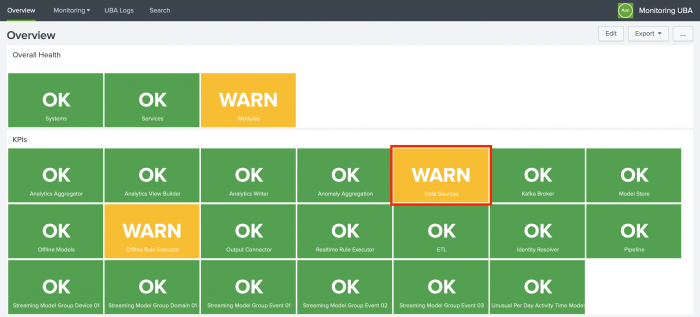
Let's examine a WARN status on the Data Sources KPI.
The WARN status from the Data Sources KPI means that one or more data sources are experiencing an issue. Click the WARN status to open the KPIs page.
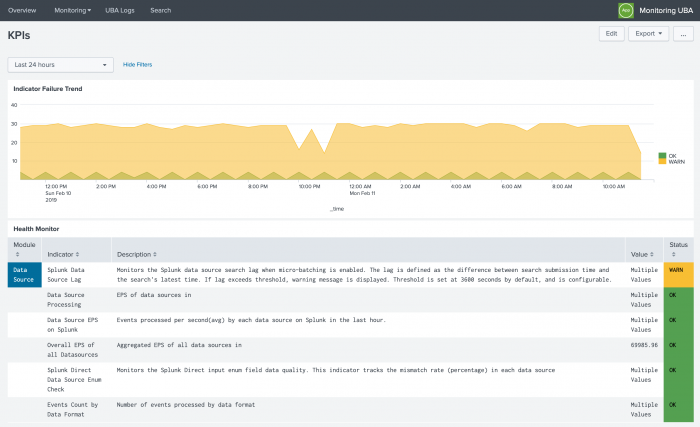
Examine the KPIs for the data sources
We can see on the screen that the Splunk Data Source Lag indicator is the one giving us the warning.
The graph in the Indicator Failure Trend shows that over the last 24 hours there has been a fairly consistent warning status for this data source.
Expand the time range to gather more information
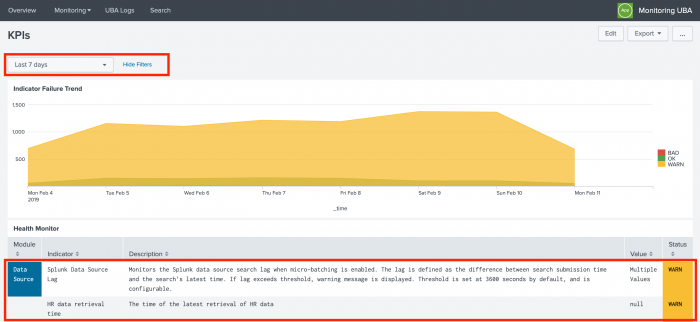
Change the time range to Last 7 days.
An additional data source, HR data retrieval time, has also generated warnings over the past week. The value for this data source is null which likely means that no data is available. Examine your HR data ingestion to continue troubleshooting this issue. See Validate HR data configuration before adding other data sources in the Get Data into Splunk User behavior Analytics manual.
The Splunk Data Source Lag shows Multiple Values in the Values column. In the Indicator Failure Trend graph, click anywhere in the shaded yellow area or click on the yellow WARN box next to the graph to view raw events in the search page.
Analyze the raw events
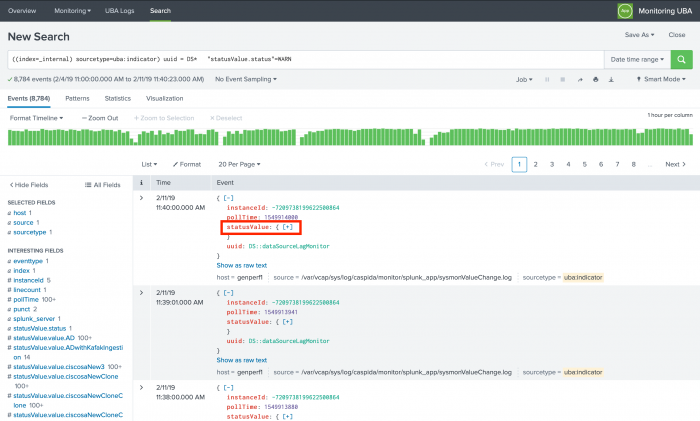
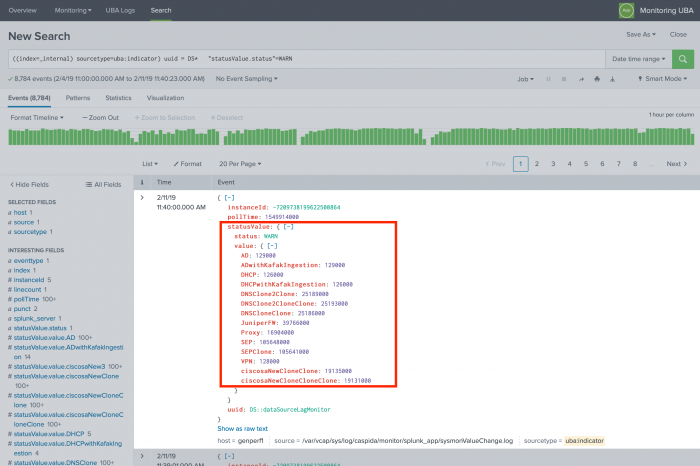
In the search page, the first event comes from the dataSourceLagMonitor. Expand the statusValue and value properties to view additional information.
View expanded information in the raw events
Now you can view the data sources being tracked by the dataSourceLagMonitor process. Examine the ones with higher numbers to continue your investigation.
Remediating the issues with the data sources
Usually when the Splunk Data Source Lag generates warnings or errors, it means that data is coming into Splunk UBA at a higher rate than can be processed. Consider the following remedies:
- Use Kafka ingestion for data sources with an EPS rate over 10,000. See Send data from the Splunk Platform directly to Kafka in the Splunk UBA Kafka Ingestion App manual.
- Split the data source into multiple smaller data sources.
- Upgrade your cluster to have more nodes. See Scaling your Splunk UBA deployment in the Plan and Scale your Splunk UBA Deployment manual.
| Examine Splunk UBA system health with the Splunk UBA Monitoring App | Example: Troubleshoot an output connector |
This documentation applies to the following versions of Splunk® User Behavior Analytics Monitoring App: 1.0.0, 1.1, 1.1.1, 1.1.2, 1.1.3
 Download manual
Feedback submitted, thanks!