Use the Hosts dashboard
The Hosts dashboard gives you a high-level view of all of the hosts in your Splunk App for Unix and Linux deployment. It displays hosts in either a list or overview format, and allows you to drill down into the specifics of a host's health and operation. It also lets you apply heat maps - graphical representations of data where individual value ranges are represented as colors - to the host views.
Host views
The Hosts dashboard displays information about hosts in two distinct views:
- Node view - where each square in the view represents a single host.
- List view - a text display of hosts with additional information about CPU, memory, disk and I/O shown.
The kind of data you can see depends on which view you are in.
List view
In list view, the Hosts dashboard displays a real-time list of hosts, groups, and CPU, memory, I/O, and disk performance metrics, constrained by the currently selected host category and group(s).
You can sort each column in ascending or descending order by clicking on the column's header. You can sort multiple columns by Alt-clicking (clicking with the Alt key held down) the desired column headers.
You can control which hosts display in the list by selecting the desired categories and groups in the host view control panel.
Node view
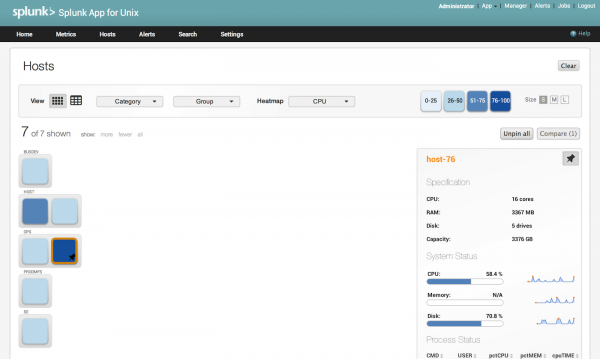
In node view, the Hosts dashboard displays a matrix of hosts, as defined by the currently selected host category and group(s). If you have selected more than one group, the dashboard separates hosts by group.
A host square represents a single host, and you can click on the host to get specific performance metrics for that host in an unobstructed side panel.
Node view also allows you to apply performance metric heat maps to the host squares to get an instantaneous view of per-host performance for CPU, memory, disk, and I/O metrics.
The host view control panel
Click for a larger image
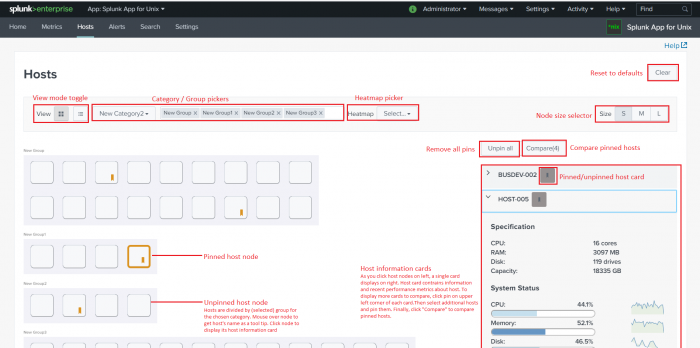
The host view control panel lets you manipulate how the Hosts dashboard displays available hosts. The control panel, situated directly underneath the "Hosts" title area, has the following controls:
View: This control lets you toggle between node and list views.
"Category" drop-down picker: This control lets you choose a category of host groups, as you defined them when you configured the Splunk App for Unix and Linux.
"Group" drop-down picker: This control lets you choose one or more groups in the selected category.
Heatmap: This control determines the heatmap that shows when the Hosts dashboard is in node view. This control is only available while in node view.
Size: These buttons allow you to change the size of the host squares when the dashboard is in node view. These controls are only available while in node view.
Underneath the host view control panel are additional controls that only appear while in node view:
Number of hosts shown: This control tells you how many hosts in the specific host category and group(s) that the Hosts dashboard currently shows.
Show more / fewer / all: These links control how many hosts display in the Hosts dashboard when it is in node view. Clicking more shows more hosts in the selected category and group, and clicking less shows fewer hosts in the selected category and group.
Unpin all / compare: These controls allow you to compare a number of hosts at the same time. The Unpin all button removes pins from any hosts that you have pinned, and the Compare button updates the Hosts dashboard to display detailed performance metrics on hosts that you have pinned. Read "Compare performance metrics on hosts" later in this topic for additional details.
Apply heat maps in node view

Click for a larger image
When in node view, you can apply a heat map to the currently displayed category and group(s) of hosts. To do so, click the Heatmap drop-down and choose the desired heat map (one of CPU, Memory, I/O, or Disk.) The Splunk App for Unix and Linux:
- updates the host view control panel to include color swatches which represent ranges of performance metric for the selected heat map.
- updates the host squares in the dashboard in real time to include heat map colors.
Get more information about a host
To get more information about a single host in a host group while in node view:
- Use the Category and Group drop-down pickers in the host view control panel to choose the group that the desired host is in.
- Mouse over the host squares. The tool tip updates to show you the host name the square underneath your mouse pointer represents.
- When you've found the host you want to get information on, click once on the square that host represents.
- You can hover over the sparklines on the middle right side of the card to see individual metrics that the Splunk App for Unix and Linux has collected recently for the host.
- You can sort the process status information in the host information card in ascending or descending order by clicking the CPU, USER, pctCPU, pctMEM, and cpuTIME column headers.
- The pin in the upper right corner of a loaded host information card allows you to keep this card available on the screen for possible comparison with other hosts later.
The Splunk App for Unix and Linux opens a "host information card" about the selected host on the far right side of the screen. This host information card displays specifications (number of CPUs, amount of RAM and disk), current system status and history, and the status of the top five processes on the host, based on CPU usage.
- To pin down an active host information card, simply click on the pin. The Splunk App for Unix and Linux highlights the pin, and the information card remains on the dashboard when you select another host. You can only pin a host information card after it has finished loading its data.
- To unpin a host information card, click on the pin again. The Splunk App for Unix and Linux removes the highlight from the pin. When you click on another host, the host information card updates with the new host's information.
- To compare multiple hosts, follow the instructions in "Compare performance metrics on hosts" later in this topic.
Note: Information displayed on host information cards does not update in real time. It represents a snapshot of the host's state when the card was opened. To see side-by-side comparisons of hosts in real time, use list view.
Compare performance metrics on hosts
This node view-only feature allows you to compare detailed performance metrics for any number of hosts in real time.
To use the comparison feature:
- Follow the instructions in "Get more information about a host" to pin the host information card.
- Repeat this process to add up to four additional hosts.
- Once you have chosen the hosts you want to compare, click the Compare button above the host information card.
Important: you must wait until all information on the host information card has updated before you can pin it and click on another host. Otherwise, the host information card will be updated using this newly clicked host.
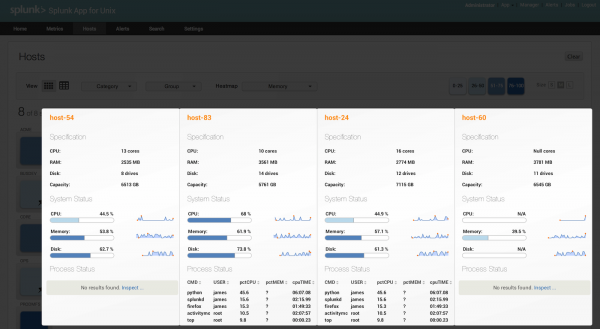
The Splunk App for Unix and Linux overlays these hosts on top of hosts that you have already pinned.
The Splunk App for Unix and Linux darkens the Hosts dashboard view and displays the host information cards of all of the pinned hosts side-by-side.
To exit out of this comparison view, click anywhere outside of the displayed cards.
To remove pins from all pinned host information cards, click the Unpin all button above the cards.
Clear all customized host display information
To clear all customizations you have made to the Hosts dashboard, click the Clear button on the upper right side of the dashboard.
| Use the Metrics dashboard | Use the Alerts dashboard |
This documentation applies to the following versions of Splunk® App for Unix and Linux (EOL): 5.2.2, 5.2.3, 5.2.4, 5.2.5, 6.0.0, 6.0.1, 6.0.2


 Download manual
Feedback submitted, thanks!