How Splunk for VMware works
The Splunk App for VMware collects VMware API data from vCenter and log data from vCenter and the ESXi hosts. vCenter log data is forwarded directly from vCenter to the indexer. ESXi log data is collected using Syslog and forwarded to the indexer using a Splunk intermediate forwarder or using a Syslog server with a Splunk forwarder monitoring logs. VMware API data is collected by Splunk through the vSphere API; this is the most challenging of the data collection tasks.
The data collection challenge is to be able to create a maintainable and scaleable solution to support business operations as they grow. This is where the Splunk App for VMware comes in using the advanced capabilities of the Distributed Collection Scheduler and domain specific data collection nodes (DCNs) to process the data from VMware and map it to the app. As an administrator you want to be able to easily scale the solution to meet the demands of your business.
The Splunk App for VMware data collection solution for collecting VMware API data consists of worker processes on data collection nodes and a Distributed Collection Scheduler that runs on the Splunk search head. The Distributed Collection Scheduler is responsible for all scaling tasks. The workers processes on the data collection nodes perform isolated collection tasks. The scheduler implementation is specific to the data collection configuration requirements for the specific domain. Data comes in and is sent using the REST API as tasks to the worker processes on the data collection nodes. The data collection nodes execute the task and forward the data to the Splunk indexers.
The Distributed Collection Scheduler
The Distributed Collection Scheduler takes the credentials for the VMware vCenter server and the knowledge it has about what data (performance, inventory, hierarchy) to collect from the vCenter server and sends this information to the data collection nodes to tell them what information it needs to collect from a specific vCenter. The Distributed Collection Scheduler manages the distribution of these data collection jobs on an interval specified in the collection configuration file on the search head. All communication is a one way street, from the Distributed Collection Scheduler to the data collection nodes. The Distributed Collection Scheduler load balances based on number of worker processes on the data collection nodes themselves, it watches the jobs queue, and is responsible for distributing credentials to the worker nodes where they are stored locally on each node (in apps.conf). Data collection nodes are added and removed from scheduler management in the Collection Configuration Dashboard in the app. Note that the Distributed Collection Scheduler does not send data to Splunk.
The cost of running the Distributed Collection Scheduler on the search head is minimal, directly related to the network traffic as jobs are assigned. Splunk forwarders must have remote login enabled which requires you to change the default admin password or change a configuration setting to support the requirement.
The Data Collection Node
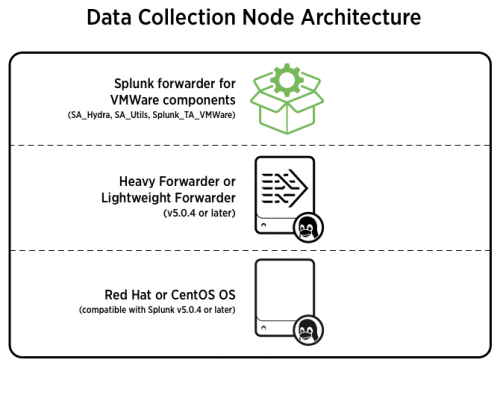
A data collection node is a splunk light forwarder or heavy forwarder that has a copy of the Distributed Collection Scheduler app (SA-Hydra) installed on it. Within the app are worker processes. These worker processes are individual input processes declared in inputs.conf of the domain specific implementation of the hydra_worker modular input.
The worker process on the data collection nodes constantly check the hydra_job.conf file for new jobs assigned to the data collection node by the Distributed Collection Scheduler and find out what they are supposed to do. When a new job comes in, the job is claimed and executed, and conforming to Splunk best practices for modular inputs processes, it sends its output to stdout and lets splunk forwarding handle the rest. The data collection node manages the worker processes, manages the jobs and sessions with target entities from which they collect data, and initiates log message handling (all logs are written to hydra_worker.log). The data collection node is essentially a Splunk forwarder with job and process management built in.
Supportability
Detailed logging is implemented as part of the scheduler management and process management. You can set individual logging levels. All of these logs go to index=_internal.
Scalability
Increased or decreased demand in data collection is met by increasing or decreasing the number of data collection node in your environment and/or increasing or decreasing the number of processes per data collection node.
| Component reference table | The Collection Configuration dashboard |
This documentation applies to the following versions of Splunk® App for VMware (EOL): 3.1

 Download manual
Feedback submitted, thanks!