Virtual Machine Detail
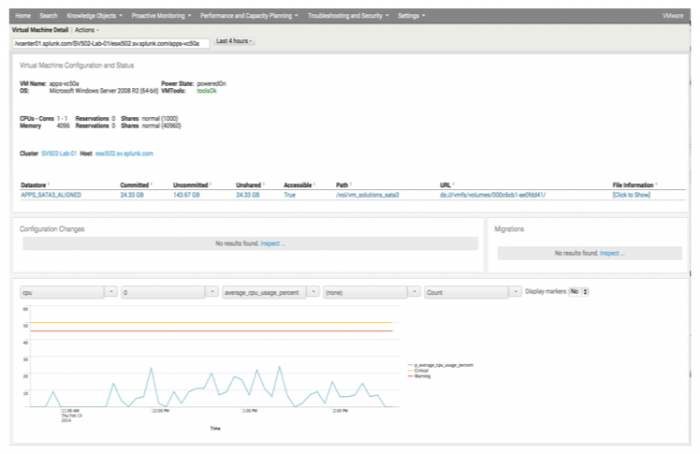
On this dashboard you can see the details for a specific virtual machine. Using this dashboard you can:
- Track virtual machines in your environment as they migrate across hosts.
- Identify the root cause of issues.
- Check how the virtual machine performs for key performance metrics.
- Get insight into the granular virtualization layer data, which helps solve problems quickly.
Virtual Machine Configuration and Status
This panel provides basic configuration information about the state of your virtual machine. It displays:
- The name of the virtual machine.
- The operating system installed on it.
- The state of the virtual machine, whether it is powered on or off.
- A status for VMTools, if VMTools is installed on it.
- The resource details of the virtual machine. Having sufficient resources is important to prevent a bottleneck in your system. The resources include the number of vCPUs (cores) assigned to the virtual machine, the memory allocation as well as the reservations and shares for each of these resources.
- The cluster and the host to which it belongs. Drill down on the cluster or the host information to get to the detail dashboards for the selected entity.
- High level details about the datastore connected to the virtual machine and how much space the virtual machine is taking up on the datastore.
Drill down on the Datastore details
Click the datastore name to drill down to the specific details for that datastore, shown on the Datastore Detail dashboard.
Click [Click to Show] to see the file types and fie sizes for this virtual machine. You get visibility into the types of files that take up space on the datastore. This view enables you to plan your storage requirements. For example, if log files are taking up a lot of space, you can create a report that tells you the amount of space that log files are taking up on the datastore.
Configuration Changes
Look at this panel to see all of the configuration changes for the virtual machine.
You can investigate the root cause of problems. For example, If a virtual machine goes down you can check if a scheduled task or an unscheduled task was the cause of the outage. You can also check resource allocations, such as how CPU or memory resources changed for the virtual machine.
Migrations
Look at this panel to see all of the migrations for the specific virtual machine.
If the virtual machine migrated from one host to others over a period of time, the list of hosts is displayed. You can use the chart in the last panel to split migrations across hosts to get more detailed information.
Chart of performance data for a virtual machine
In this panel you can look at the virtual machine at a very detailed level. You can:
- Control the charting of performance data for a specific virtual machine.
- Show the performance of the virtual machine as it migrated across hosts.
- See when the virtual machine was last on a host.
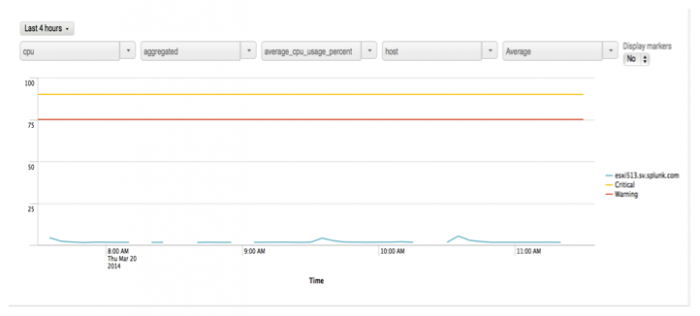
The chart shows the performance of the virtual machine for a metric of a specific performance data type, optionally split by host, mapped against the critical and warning threshold for the metric selected. The chart is driven by performance metrics for the virtual machine.
Use the drop-down lists to filter your selection for charting the data. Select from the following:
- The performance type. This is the type of performance data you want to measure for the virtual machine.
- Instance data. If instance level data is turned on, this drop-down list is populated with values representing instances. If instance level data is not being collected from your environment, then the menu defaults to aggregated (aggregated data for all of the instances).
- The performance metric to measure.
- The statistical operation on the data (average, min, max),
You can correlate the data with migration information for the virtual machine. Use the “split by” drop-down list to correlate the data by the physical host of the virtual machine (this is the physical host for a specific data point) You can see a history of where the virtual machine has been over a period of time (the hosts it resided on). You can also see when the virtual machine was last on a host.
To filter the data and split by host:
- Select a performance type, such as cpu, from the drop-down list.
- Select a value for instance data from the options available, if you have instance level data turned on, or select aggregated.
- Select a metric for the performance type, such as average_cpu_usage_percent.
- Select none or host. Selecting host charts the data and splits it by host. If the virtual machine migrated, all of the hosts on which it resided are displayed in the chart. Splitting by host shows a history of what host it was on and when. Keep the value at none if you do not want to split the results
- Select how you want to view the data on the chart.
A chart is displayed showing the critical and warning threshold levels set for the selected metric. The performance of the virtual machine in relation to this metric is charted. If the virtual machine migrated from one host to others, then the results are split across the hosts. Check for spikes on the chart and investigate why they are happening.
| Proactive Monitoring | Host System Detail |
This documentation applies to the following versions of Splunk® App for VMware (EOL): 3.4.0


 Download manual
Feedback submitted, thanks!