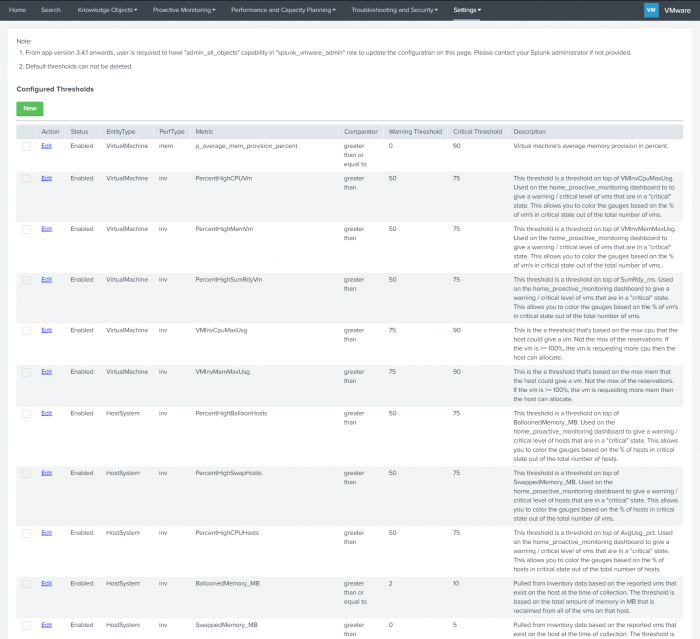
Threshold Configuration
The Threshold Configuration dashboard is an administration dashboard with restricted access to users of the Splunk App for VMware who have administration privileges. If you do not have these privileges, then you cannot access this dashboard.
Use the Threshold Configuration dashboard to configure threshold settings for performance metrics that have default threshold set for them in the Splunk App for VMware. All metrics listed on this page can be found in VMware's PerformanceManager or VMware VirtualMachineQuickStats unless it is a Splunk defined metric.
By default, the Splunk App for VMware collects the complete set of VMware performance metrics. You can see the complete set of metrics in the Splunk App for VMware on the Proactive Monitoring dashboard and on the Performance of Hosts and VMs Dashboard.
Using the Threshold Configuration dashboard you can:
- Add and delete metrics.
- Editing warning and critical threshold values for metrics.
- Enable or disable metric collection.
For more information, see "Add, edit, and delete threshold settings" and the "Performance metrics reference table" in the Splunk App for VMware Configuration Guide.
| Useful Saved Searches | App Install Health |
This documentation applies to the following versions of Splunk® App for VMware (EOL): 4.0.0, 4.0.1, 4.0.3

 Download manual
Feedback submitted, thanks!