Error reporting
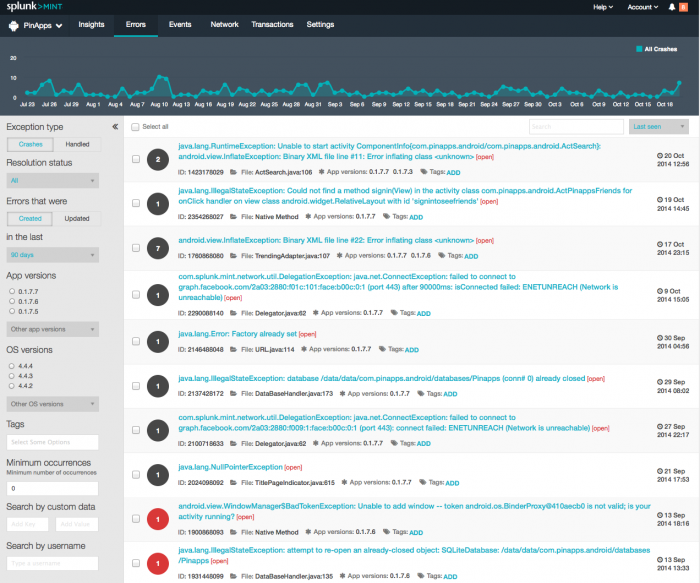
The Errors dashboard lets you track errors by session, unique users, application crashes, crash rates per user, engagement, and user retention by application version in real time. You can capture breadcrumbs, NSLog, and LogCat information. And most important, you gain context for why errors are taking place.
The Errors dashboard shows a summary of error activity over the last seven days. Use the filters to display errors by different criteria. For example, search through crashes by user name or user ID to immediately see how many times each error affected a particular user. You can also see when the last error occurred, the app version, the OS version, and the device the user was using. Then, click an error to see details about it:
- A summary of the error, including a stack trace, error instances, and breadcrumbs.
- Access to integrations with developer tools, if you have any. For more, see Integrate with developer tools in this manual.
- A history of occurrences of the last seven days.
- A breakdown of occurrences of this error by app version, OS version, and device.
Data retention
The retention period for data is as follows:
- All aggregated data (on Insights, Events, Transactions, and Network dashboards) has a retention period of seven days.
- Crash reports have a retention period of 90 days.
- The Free plan has three days retention period for Insights and Events.
iOS error symbolication
Before you can analyze crash reports, the stack traces need to be symbolicated—that is, replace memory addresses with human-readable function names and line numbers. These debug symbols are contained in dSYM bundles that are are updated periodically. For details, see Configure your project for symbolication in the Splunk MINT SDK for iOS Developer Guide.
Retrace an Android error with ProGuard
If you are using ProGuard, you can manage uploads of your mappings file and retrace on the fly.
- Go to Settings, and then under Project Settings click ProGuard to upload mappings files.
For more, see Use ProGuard with Splunk MINT in the Splunk MINT SDK for Android Developer Guide.
To get more data about your errors and crashes from your mobile apps, see the following topics in the Splunk MINT SDK Developer Guides:
| Insights | Event monitoring |
This documentation applies to the following versions of Splunk MINT™ Management Console (EOL): 1.0

 Download manual
Feedback submitted, thanks!