Event monitoring
The Events dashboard is where you monitor specific activities in your mobile apps. Create developer-defined events to gauge specific areas of application usage. Visualize insights on how users are actually interacting with your app.
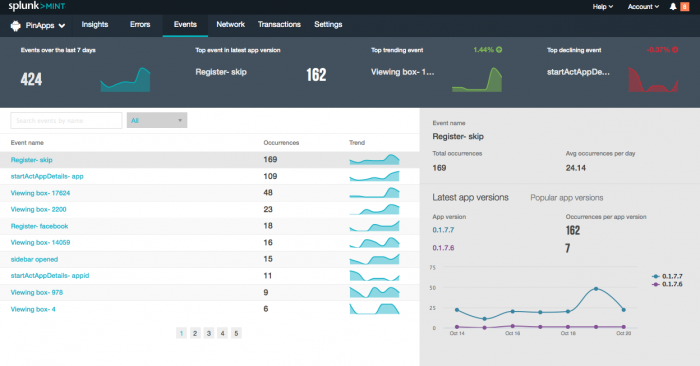
The charts on the Events dashboard summarize activity over the last seven days. You can quickly see how many events there were, the most frequent event, which events are occurring more often (trending up) or less frequently (declining).
The table shows the events that have occurred over the last seven days. Click an event to see details about it:
- The total number of occurrences and the average per day.
- The number of occurrences by the latest or most popular app version.
Add events to your mobile apps
To add events to your mobile apps, see the following topics in the Splunk MINT SDK Developer Guides:
| Error reporting | Network monitoring |
This documentation applies to the following versions of Splunk MINT™ Management Console (EOL): 1.0

 Download manual
Feedback submitted, thanks!