Use the Collection Configuration page to add configurations
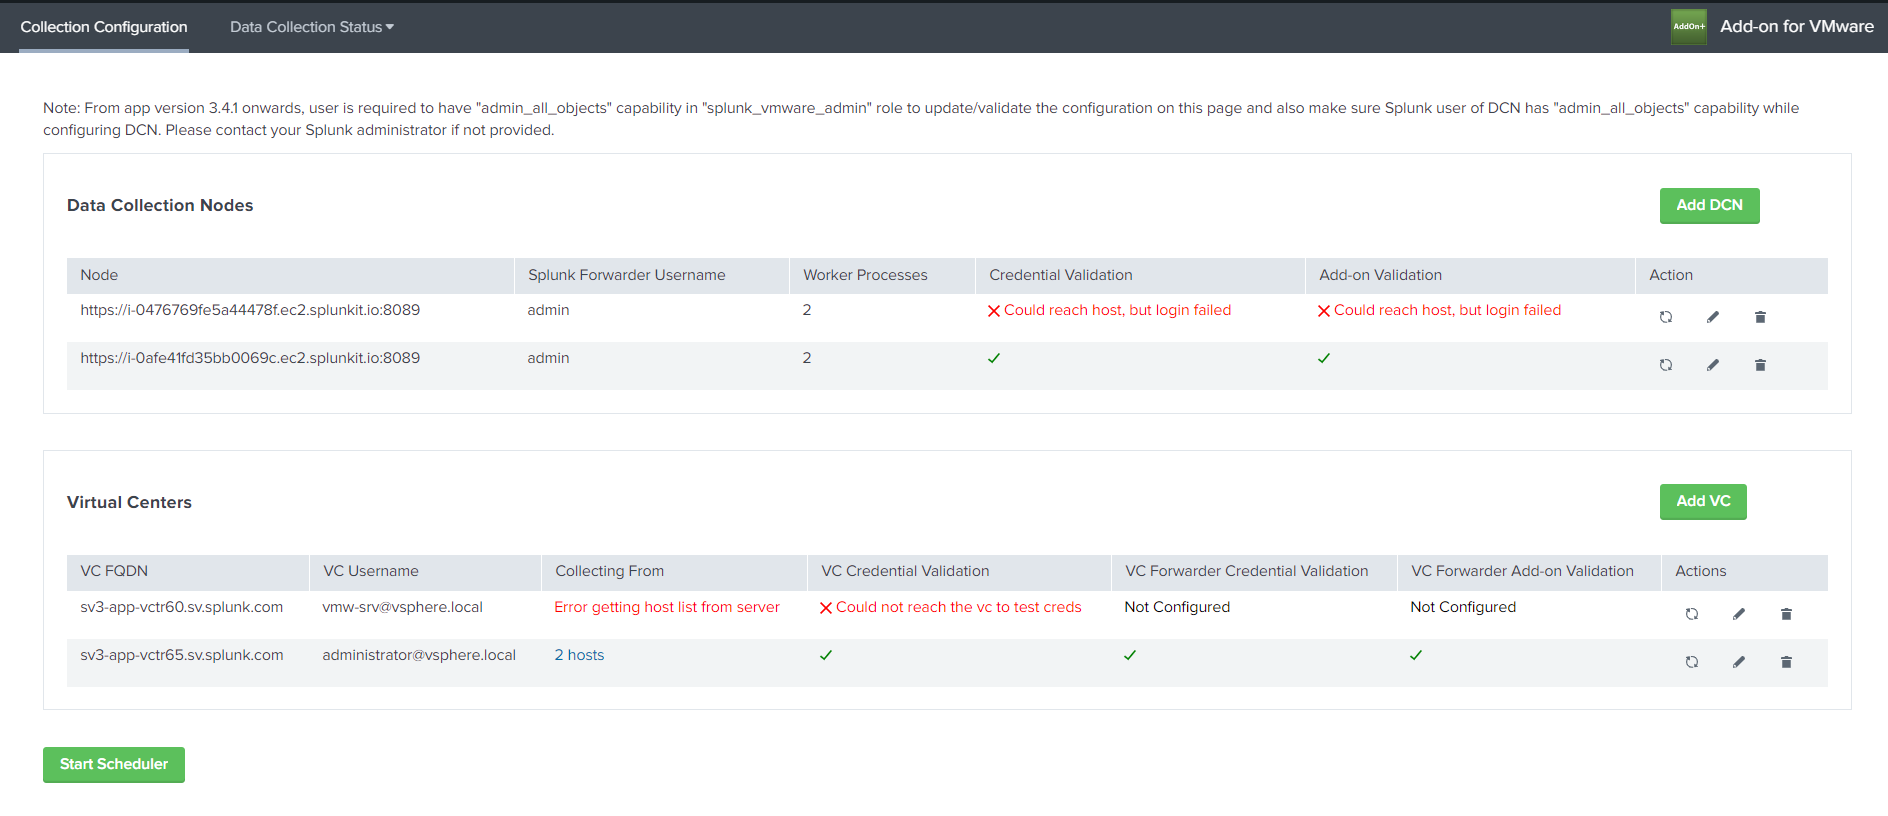
The Collection Configuration dashboard, on the Scheduler, manages the collection of Data Collection Node (DCN) and Virtual Center data. Register all data collection nodes with the Collection Configuration dashboard in order to collect data from vCenter Server. You must configure each DCN separately with the scheduler.
Data Collection Node configuration
- Navigate to the Collection Configuration page.
- Under Data Collection Nodes, Click on Add DCN.
- Enter in your Splunk Forwarder URI, Username, Password, and number of Worker Processes
Data Collection Node configuration settings table
Field Value Splunk Forwarder URI The address or port of the DCN. For example, https://<host_name_or_ip_address_of_DCN>:8089. Splunk Forwarder Username admin. Splunk Forwarder Password The administrator password. Make sure this password is not the Splunk Enterprise default admin password (changeme). Worker Processes Define the number of worker processes you want on the node. This is the number of processes you can run on the data collection node to process the data and forward it to the indexer(s). You can run a maximum of 8 processes per node at the default configuration. The number of worker processes must be one fewer than the number of CPU cores the vCenter Server system granted to the DCN. For example, if the DCN has four CPU cores, the number of worker processes is three. - Click Save
- Confirm that you correctly configured the DCN by verifying that the DCN, credential validation, and add-on validation all display a green check.
- Repeat the steps for each DCN.
Data Collection preferences configuration
Use data collection preferences to allow or block performance metrics for the host, VM, cluster and resourcepool.
- Virtual Machine Metric Allowlist, Virtual Machine Metric Denylist, Host Metric Allowlist and Host Metric Denylist options are shown and affected only when hostvmperf task is enabled from the Collection Configuration page.
- Cluster Metric Allowlist, Cluster Metric Denylist, ResourcePool Metric Allowlist and ResourcePool Metric Denylist options are shown and affected only when otherperf is enabled from the Collection Configuration page.
- Navigate to the Collection Configuration page.
- Select Data Collections preferences.
- Enter your metric preferences:
Field Value VM Metric Allowlist Collects data of VM performance metrics matched with the regex, by default it will collect all metrics unless specified as regex. For example .*_cpu_.*,.*_net_.*VM Metric Denylist Collects data of VM performance metrics not matched with the regex, by default it will collect all metrics unless specified as regex. For example .*mem.*Host Metric Allowlist Collects data of Host performance metrics matched with the regex, by default it will collect all metrics unless specified as regex. For example ^p_average.*,.*_cpu_.*Host Metric Denylist Collects data of Host performance metrics not matched with the regex, by default it will collect all metrics unless specified as regex. For example .*_cpu_.*,.*_disk_.*Cluster Metric Allowlist Collects data of Cluster performance metrics matched with the regex, by default it will collect all metrics unless specified as regex. For example .*_(clusterServices|cpu).*, default value is ^p_(?!average_cpu_reservedCapacity_megaHertz).*_(clusterServices|cpu).* Cluster Metric Denylist Collects data of Cluster performance metrics not matched with the regex, by default it will collect all metrics unless specified as regex. For example p_average_cpu_reservedCapacity.*ResourcePool Metric Allowlist Collects data of ResourcePool performance metrics matched with the regex, by default it will collect all metrics unless specified as regex. For example .*_cpu_.*ResourcePool Metric Denylist Collects data of ResourcePool performance metrics not matched with the regex, by default it will collect all metrics unless specified as regex. For example .*_cpu_.* - Click Save.
Virtual Center configuration
Add a vCenter Server system as a source of data in your environment.
- Navigate to the Collection Configuration page.
- Under Virtual Centers, click Add VC.
- Enter in your Virtual Center FQDN, VC Username, VC Password, and select the Collect from all hosts checkbox.
Field Value Virtual Center FQDN The fully-qualified domain name for the vCenter server. For example, test-vcenter100.example.comVC Username The user name that you configured in vCenter Server for Splunk Enterprise. Use the format username@domainif the user is an Active Directory account.VC Password The password that you configured in vCenter Server for Splunk Enterprise. - (Optional) Select the Collect from all hosts checkbox.
- (Optional) Enter in your VC Splunk Forwarder URI, 'VC Splunk Forwarder Username, 'and VC Splunk Forwarder Password.
- For the initial installation, pull 20 or fewer hosts. If the vCenter Server manages other servers, make sure that Collect form all hosts and allowlist-specific hosts are not selected.
- Click Save.
- Verify that each of the vCenter Server entries displays a green check.
- Click Start Scheduler. The Distributed Collection Scheduler is running when the button label is Stop Scheduler.
Test DCN and vCenter Server configurations
- Approximately ten minutes after you start the scheduler, access the search head and navigate to the Splunk Search field.
- Type a search string to test data collection.
- Confirm that the search returns results. Dashboards and some of the other graphics might take up to 60 minutes to populate.
sourcetype=vmware:perf* OR sourcetype=vmware:inv:hierarchy
Set performance parameters
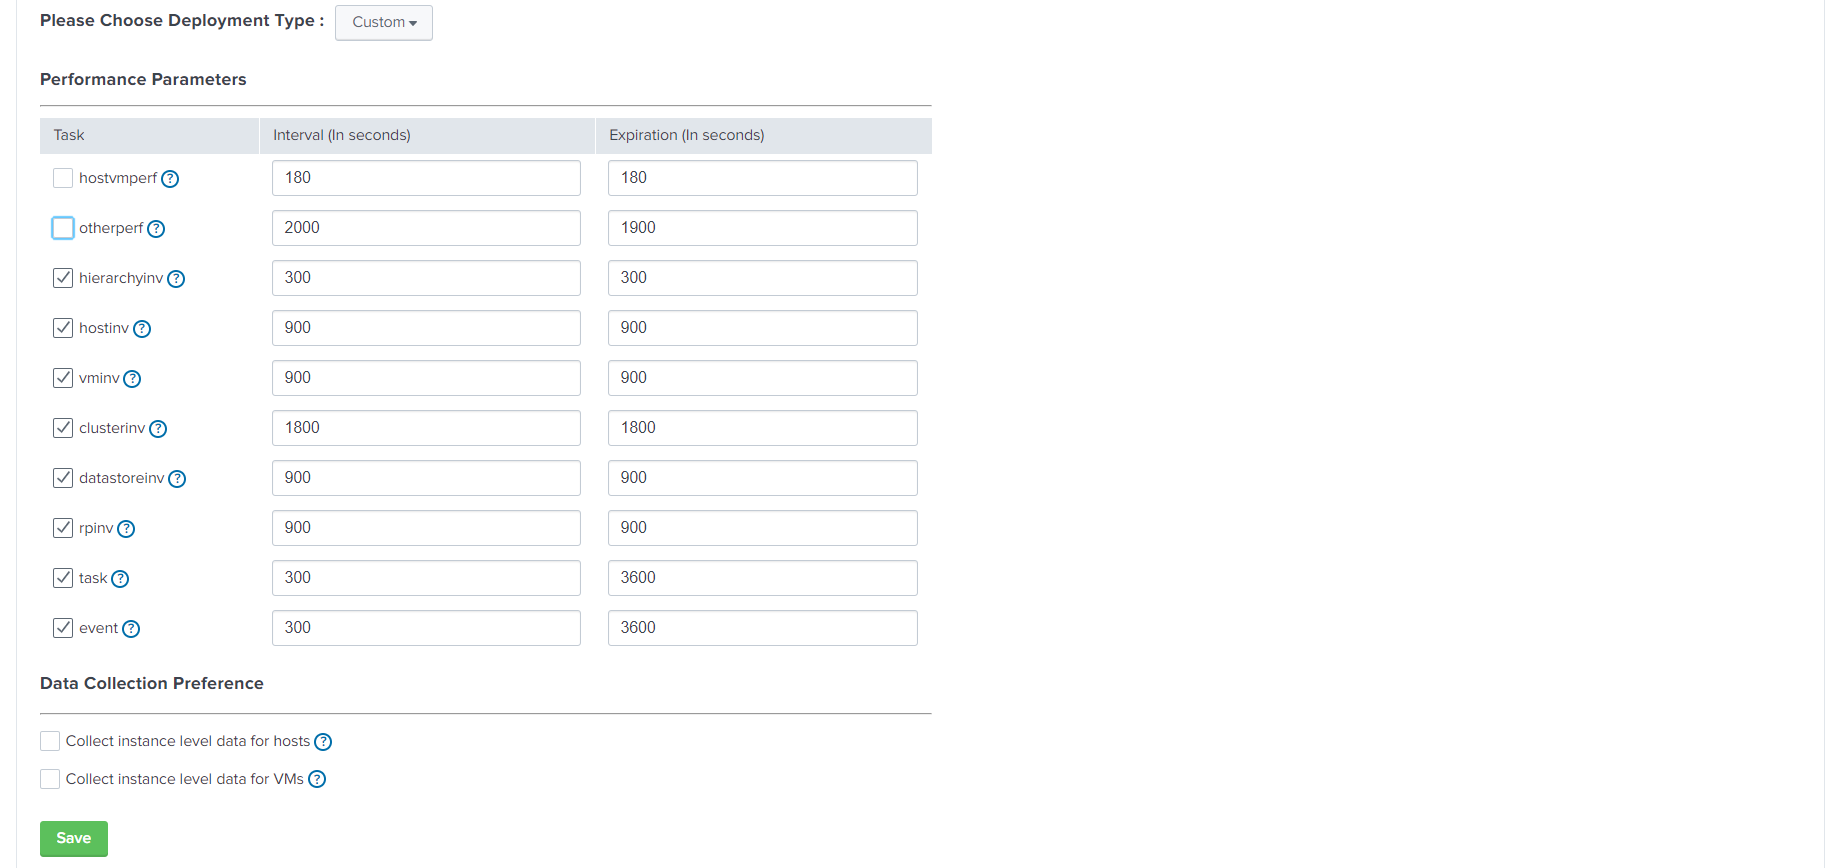
The Splunk Add-on for VMWare contains the ability to use the UI to adjust performance parameters from the Collection Configuration page.
The below table lists the default tasks that are required for either your ITSI Virtualization Module deployment, or your VMware App deployment. If you change any default settings for either deployment type, the deployment type will change to a Custom deployment type.
| Task | ITSI Virtualization Module Deployment | VMware App Deployment |
|---|---|---|
| hostvmperf | x | x |
| otherperf | x | |
| hierarchyinv | x | |
| hostinv | x | x |
| vminv | x | x |
| clusterinv | x | |
| datastoreinv | x | x |
| rpinv | x | |
| task | x | |
| event | x |
Use the Collection Configuration page to set interval and expiration times for the performance parameters of the Splunk Add-on for VMware. This information can also be adjusted using ta_vmware_collection.conf in $SPLUNK_HOME/etc/apps/TA_vmware/local/.
- Navigate to the performance parameter task that you want to adjust.
- Enter the interval amount in seconds.
- Enter the expiration amount in seconds
- Click Save.
Collect instance level data
In a "VMware" deployment type, data will not be collected at the instance level. In an ITSI deployment type, data will be collected at the instance level for only ITSI specific tasks.
With these option enabled, the VMWare add-on collects performance data of all instances of resources such as CPU, disk, datastore for hosts. e.g Each Core is an instance for the CPU resource, Each Disk Id is an instance for the Disk resource, Each Datastore Id is an instance for the Datastore resource. In the VMWare app the aggregated value returned from the vCenter API is used for performance data.
If you want to collect instance level data, navigate to the Data collection preference section of the Collection Configuration page, and check the Collect instance level data for hosts and the Collect instance level data for VMs, depending on whether you want to collect instance level data for your hosts and VMs.
| Configure the Splunk Add-on for VMware to collect log data from vCenter Server systems using the VMware API | Configure Splunk Add-on for VMware performance data collection |
This documentation applies to the following versions of Splunk® Supported Add-ons: released


 Download manual
Feedback submitted, thanks!