Configure Splunk Add-on for VMware Metrics to collect data
Configure the Splunk Add-on for VMware Metrics to collect Virtual Center data using Data Collection Nodes (DCNs). Identify the data types you want to collect, such as performance, inventory, or tasks and events data, from the following list:
- vCenter logs (Intermediate Forwarder/Syslog Forwarder). For more information, see Configure Splunk Add-on for VMware Metrics to collect vCenter Server log data.
- ESXi logs (Intermediate Forwarder/Syslog Forwarder). For more information, see Configure Splunk Add-on for VMware Metrics to collect ESXi log data.
- Performance metrics, inventory, tasks (vCenter API collected by Data Collection Node). For more information, see Configure the Splunk Add-on for VMware metrics to collect log data from vCenter server systems using the VMware API.
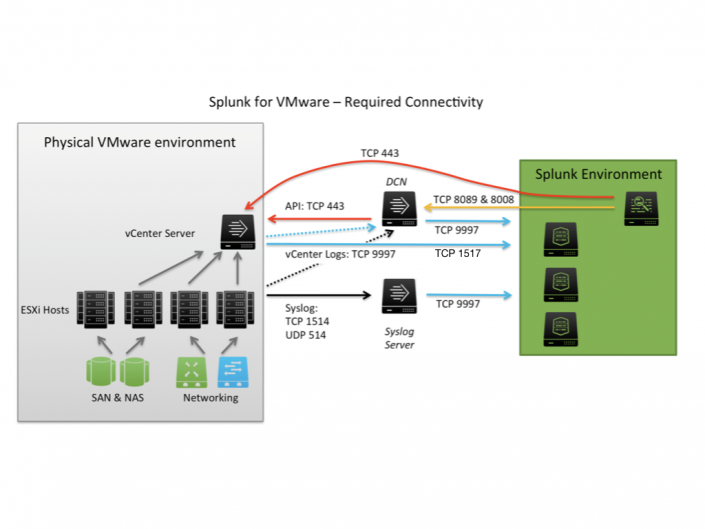
The following diagram shows the components that communicate with each other and the ports they use to communicate:
Configure collection of performance, configuration, and event data
Perform the following steps to configure collection of performance, configuration, and event data.
Change the NTP server pool list
A system uses the Network Time Protocol (NTP) to synchronize its time with another reference time source. If you're experiencing time synchronization issues between the indexer, DCN, and vCenter Server, change the NTP servers that the DCN uses.
- On the instance running the DCN, go to
/etc/ntp.conf. These are the following values:# Use public servers from the pool.ntp.org project. # Please consider joining the pool (http://www.pool.ntp.org/join.html). server 0.centos.pool.ntp.org server 1.centos.pool.ntp.org server 2.centos.pool.ntp.org
- Replace the default values in the file with your NTP server values.
- Restart
ntpd:$ sudo service ntpd restart
Disable NTP on the DCN
If you deployed a DCN in a vCenter Server and it doesn't have internet access, disable NTP on the DCN. If you disable NTP, enable VMware Tools Clock Synchronization to establish the time for the DCN using the ESXi host.
- Stop
ntpd:$ sudo service ntpd stop
- Configure
ntpdso that it doesn't run when the system starts:$ sudo chkconfig ntpd off
- Enable VMware Tools Clock Synchronization:
$ vmware-toolbox-cmd timesync enable
- Confirm that VMware Tools Clock Synchronization is enabled:
$ vmware-toolbox-cmd timesync status
Configure Splunk Add-on for VMware Metrics to collect specific data
The Splunk Add-on for VMware Metrics collects the following data when you configure a DCN and vCenter server on the DCS and start the Scheduler:
- Performance data of hosts, virtual machines, clusters, and datastores
- Inventory data of hosts, virtual machines, clusters, datastores, and hierarchy
- Tasks and events data of configured vCenter servers
Based on the requirements, you can configure the task parameter of the inframon_ta_vmware_pool.conf file to collect specific information from the types of data mentioned above. The following table shows a mapping of the configurable values of the task parameter and the data the add-on collects when the given value is specified. To specify multiple parameters, separate the values with commas.
| Value used with the task parameter | Data collected |
|---|---|
| hostvmperf | Host/VM Performance Data |
| clusterperf | Cluster Performance Data |
| hostinv | Host Inventory Data |
| vminv | VM Inventory Data |
| clusterinv | Cluster Inventory Data |
| datastoreinv | Datastore Inventory Data |
| hierarchyinv | Hierarchy Inventory Data |
| task | vCenter Tasks Data |
| event | vCenter Events Data |
| vcperf | vCenter Performance Data |
| datastoreperf | Datastore Performance Data |
Default configuration
The following configuration is the default configuration of the task parameter from the inframon_ta_vmware_pool.conf file:
[Global pool]
task = hostvmperf, clusterperf, hostinv, vminv, clusterinv, datastoreinv, hierarchyinv, task, event, vcperf, datastoreperf
Example
To collect only the performance data of hosts, virtual machines, clusters, and datastores, perform the following steps on Data Collection Scheduler (DCS). This configuration applies to data collection of all configured vCenter servers:
- Stop the Scheduler from the Collection Configuration page of Splunk Add-on for VMware Metrics on the DCS machine.
- Stop the Splunk server on the DCS machine.
- On DCS machine, open or create a local copy of the inframon_ta_vmware_pool.conf file in $SPLUNK_HOME/etc/apps/Splunk_TA_vmware_inframon/local. Add the following setting under the
[Global pool]stanza:task = hostvmperf, clusterperf, vcperf, datastoreperf
- Start the Splunk server on the DCS machine.
- Start the Scheduler from the Collection Configuration page of Splunk Add-on for VMware Metrics on the DCS machine.
| Deploy the Splunk Add-on for VMware Metrics on your indexers | Configure the Splunk Add-on for VMware metrics to collect data from vCenter server systems using the VMware API |
This documentation applies to the following versions of Splunk® Supported Add-ons: released

 Download manual
Feedback submitted, thanks!