Access dashboards
The Access Protection domain monitors authentication attempts to network devices, endpoints, and applications within the organization. Access Protection is useful for detecting malicious authentication attempts as well as identifying what systems users have accessed either in an authorized or unauthorized manner.
Access Center dashboard
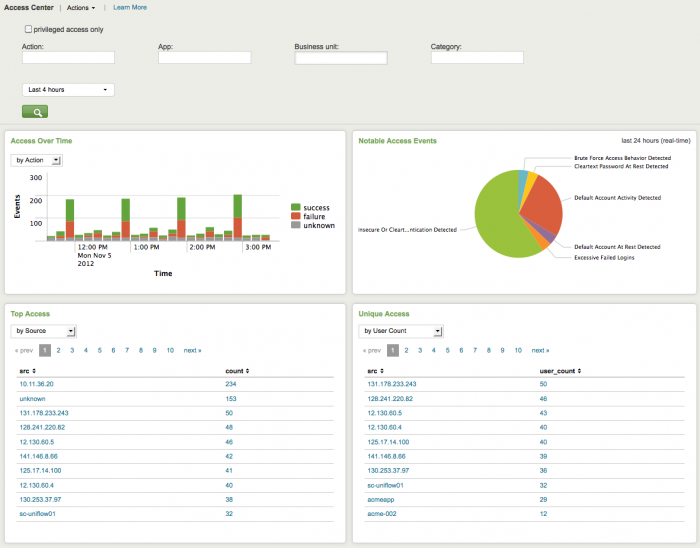
The Access Center provides a summary of all authentication events. This summary is useful for identifying security incidents involving authentication attempts such as brute-force attacks, or the use of clear text passwords, or for identifying authentications to certain systems in off-hours.
Use the filtering options at the top of the screen to limit which events are shown. Configure new data inputs through the Settings menu, or manage the list of privileged accounts through Enterprise Security Configuration.
Clicking chart elements or table rows on this page will display the raw events that are represented. See dashboard drilldown for more information. The following table describes the panels for this dashboard.
| Panel | Description |
|---|---|
| Dashboard filter | Restricts the view on the current dashboard to events that match the selected criteria. Selections apply to the current dashboard only. The following special filter is available:
See descriptions of the standard filter options. |
| Notable Access Events | Displays notable events by type and overall percentage relative to total number of access events. Notable access events are events such as: the detection of default accounts, brute-force behavior, and so on. |
| Access Over Time | This chart provides a summary count of authentication events over time by either action or by the application that performed the authentication. For example, "win:local" refers to the local authentication performed on a Windows system (using the keyboard) and "win:remote" refers to a remote API (such as telnet). |
| Top Access | This table provides the systems with the most access events by source (devices that accessed other devices on the network most frequently) or by destination (devices that were most frequently accessed). This table is useful for detecting brute force attacks, since devices that repeatedly attempt to authenticate are at the top of the list. |
| Unique Access | This table lists the sources that generated the most authentication events by unique user, destination, or application. This table is useful for detecting brute force attacks: * Attacks that target a single account across any number of hosts, will show a high number of destinations accessed. * Attacks that target a single system with a high number of authentication attempts, will show a high number of users. |
Access Tracker dashboard
The Access Tracker dashboard gives an overview of accounts that are newly active or newly inactive, including accounts that have been inactive for a period of time and recently became active again. It is not uncommon for accounts to incorrectly remain on the system when a user leaves the organization. These accounts are often vulnerable to attackers. It is a good idea to check this dashboard on a regular basis per the enterprise security policy to see inactive accounts. In addition, a security analyst may use this dashboard during an investigation to identify suspicious accounts and look more closely at what those users have been doing.
In addition to this dashboard, the Splunk App for Enterprise Security includes correlation searches for accounts that have been active for a long period, or inactive accounts that become active. These correlation searches create notable events that are displayed in the Incident Review dashboard.
The following table describes the panels for this dashboard. Drilldown is available for graphs and tables. See dashboard drilldown for more information.
| Panel | Description |
|---|---|
| Dashboard filter | Restricts the view on the current dashboard to events that match the selected criteria. Selections apply to the current dashboard only. See descriptions of the standard filter options. |
| First Time Account Access | Summarizes activity for all accounts that were first accessed within the specified time frame (default = 30 days). Use this panel to verify that new account usage follows normal patterns or to locate accounts that look incorrect. |
| Inactive Account Usage | Displays accounts that were inactive for a period of time, but that have shown recent activity. These accounts may have been successfully attacked. |
| Completely Inactive Accounts | Displays accounts that have shown no activity in the time specified (default = 90 days). Use this panel to identify accounts that should be deleted from the system - for example, accounts that belong to people who have left the organization. If the organization has a policy that requires password change after a specified interval, then accounts that have shown no activity for more than that interval are known to be inactive. This panel also indicates the effectiveness of the enterprise's policy for closing accounts. If there are a large number of inactive accounts, the process may need to be reviewed. |
| Account Usage for Expired Identities | Summarizes activity for all accounts that are marked terminated within the specified time frame (default = 30 days). Use this panel to verify that accounts that should no longer have activity are not being used. |
Access Search dashboard
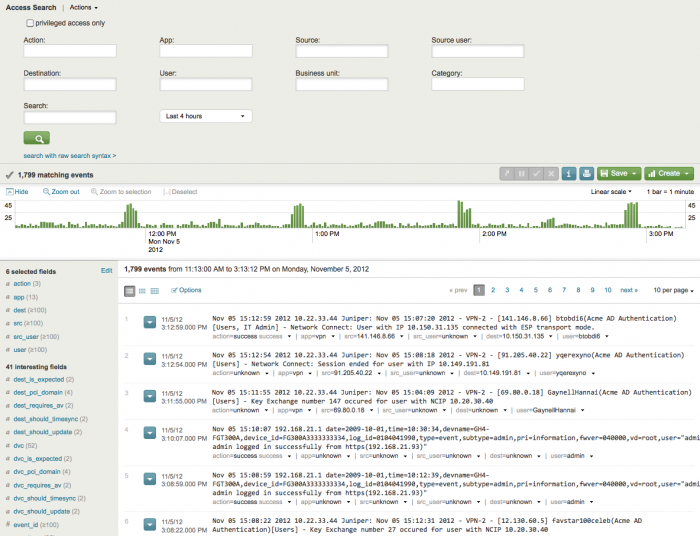
The Access Search dashboard is used to search for specific authentication-related events. Access Search is similar to the normal Splunk search dashboard, but provides an additional search filters that helps to search for authentication events. There are two ways to get here: by selecting directly from the menu or as part of a workflow from other parts of the application. Coming from another part of the application, certain fields will be pre-populated in the search, although in some cases there may be a reason to move a value to a different field (for example, to search on an IP as a dest rather than a src).
The following filter options are available:
| Filter | Description |
|---|---|
| Action | Sets whether to see successes or failures; leave blank to see all actions |
| App | Sets a specific access method; leave blank to see all access methods |
| Source | Specifies a string that the source must match |
| Source user | Specifies a string that the source user must match |
| Destination | Specifies a string that the destination must match |
| User | Specifies a string that the user must match |
| Business unit | Specifies the business unit that the search must match |
| Category | Specifies the category (from a drop-down list) that the search must match |
| Search | Specifies the type of search the search must match |
| Time range | Specified the time range (from a drop-down list) that the search must match |
Correlate with other domains
To get more information about a host involved in an event, right-click on the down arrow next to the field value at the bottom of the event.
Account Management dashboard
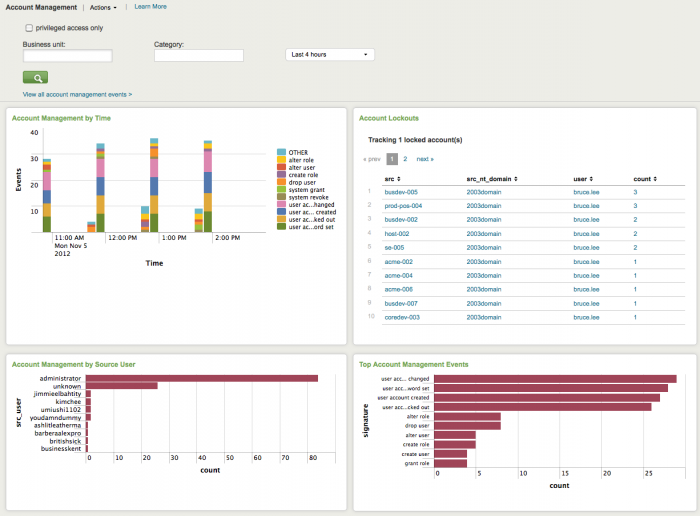
The Account Management dashboard shows changes to user accounts, such as account lockouts, newly created accounts, disabled accounts, and password resets. Use this dashboard to verify that accounts are being administered correctly and that administration privileges for each type of account are restricted to the correct users and roles. A sudden increase in the number of accounts created, modified, or deleted can mean a rogue system or malicious behavior. A high number of account lockouts may indicate an attack.
Use the filtering options at the top of the screen to limit which events are shown. Configure new data inputs through the Settings menu, or manage the list of privileged accounts through Enterprise Security Configuration.
Click on chart elements or table rows to display the raw events that are represented. See dashboard drill-down for more information.
The following table describes the panels for this dashboard.
| Panel | Description |
|---|---|
| Dashboard filter | Restricts the view on the current dashboard to events that match the selected criteria. Selections apply to the current dashboard only. The following special filter is available:
|
| Account Management by Time | Shows all user account management events over time. For example, a spike in lockout events may indicate a brute-force attack. |
| Account Lockouts | Shows all account lockouts including the number of authentication attempts per account. Brute-force attacks generally show up as multiple locked-out accounts, often using default account names like "administrator" or "root". |
| Account Management by Source User | Tracks the total account management activity by source user and shows the source users with the most account management events. The source user is the user that performed the account management event, rather than the user that was affected by the event. For example, if user "John.Doe" creates an account "Martha.Washington", then "John.Doe" is the source user. This panel helps identify accounts that should not be managing other accounts and shows spikes in account management events, such as the deletion of a large number of accounts. |
| Top Account Management Events | The Top Account Management Events panel shows the most frequent management events in the specified time period. |
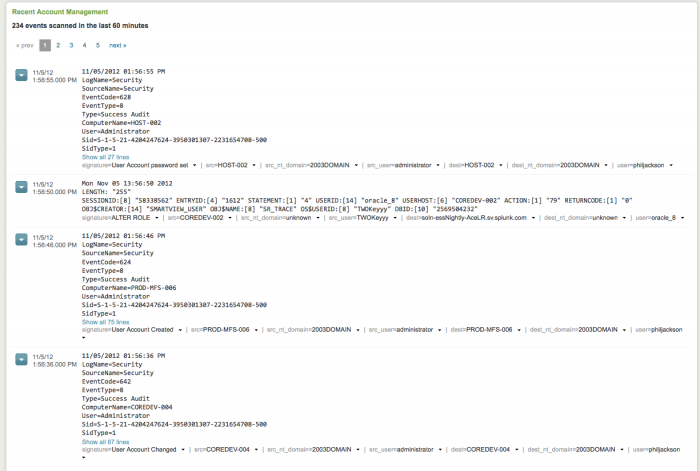
| Recent Account Management | Summarizes all account management events in the past 60 minutes. This panel can be useful during an investigation. |
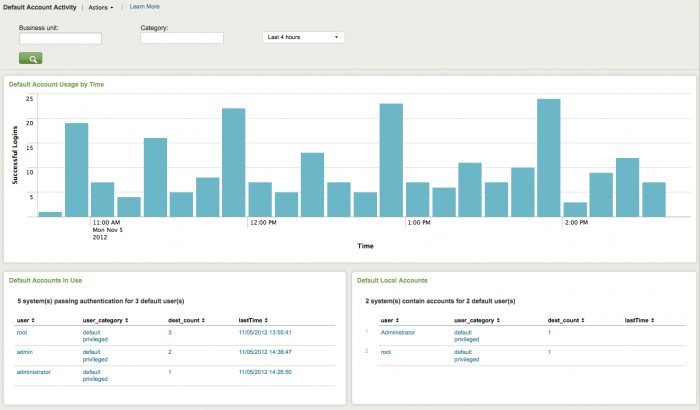
Default Account Activity dashboard
The Default Account Activity dashboard shows activity on "default accounts", that is, out-of-the-box accounts that are enabled by default on various systems, including network infrastructure devices, databases, and applications. Default accounts have well-known passwords and are often not disabled properly when the system is deployed.
In addition, there may be a need to monitor or investigate authorized use of a default account. Many security policies require that default accounts be disabled. When security policies allow the use of default accounts, it is important to make sure that the password has been changed from the default. Abnormal or deviant behavior can indicate security threats or policy violations. If the organization has a policy restricting default accounts, make sure to monitor this dashboard on a regular basis.
The following table describes the panels for this dashboard. Drilldown is available for graphs and tables. See dashboard drilldown for more information.
| Panel | Description |
|---|---|
| Dashboard filter | Restricts the view on the current dashboard to events that match the selected criteria. Selections apply to the current dashboard only. See descriptions of the standard filter options. |
| Default Account Usage by Time | Shows default account activity on all systems and applications within the infrastructure in the selected time frame. Accounts are shown by the number of successful login attempts and when the last attempt was made. Use this chart to identify spikes in default account login activity, which may indicate a security incident as well as to determine whether default account use is common (for example, a daily event) or rare. |
| Default Accounts in Use | Shows all default user accounts with a high number of login attempts on different hosts, including the last attempt made. Abnormal default user account activity that could indicate a security threat. Also helps ensure that default account behavior matches the security policy. |
| Default Local Accounts | Lists all default accounts that are active on the enterprise systems, including accounts "at rest". Any default accounts that are available are listed, regardless of whether the account was actually used. Only those accounts that were detected on a local system - for example, by examining the users list on a host - are included in this list. |
| Advanced Threat dashboards | Endpoint dashboards |
This documentation applies to the following versions of Splunk® Enterprise Security: 3.1, 3.1.1, 3.2, 3.2.1, 3.2.2
 Download manual
Feedback submitted, thanks!