Endpoint dashboards
The Endpoint dashboards provide a view into malware events including viruses, worms, spyware, attack tools, as well as endpoint protection deployment.
Malware Center
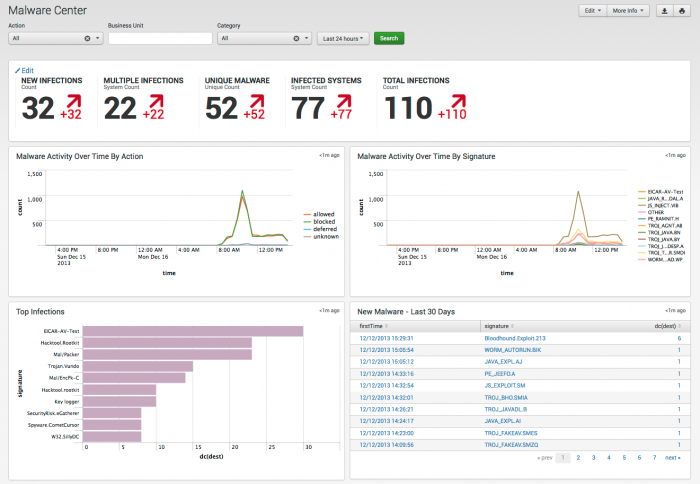
The Malware Center provides an overall picture of malware in your environment and a snapshot of Malware presence is changing over time, based on data gathered by Splunk.
Relevant data sources
Relevant data sources for the Malware Center include firewall devices, intrusion detection software, system logs, and related network sources.
How to configure this dashboard
1. Index relevant data sources from a device, application, or system in Splunk.
2. Map the data to the Malware data model. See the Common Information Model Add-on Manual for more information. The Common Information Model fields bunit and category are derived by automatic identity lookup, and do not need to be mapped directly.
3. Tag the data with "malware" AND "attack".
Dashboard description
Malware Center dashboard data is derived from the Malware data model and accelerated automatically. To verify that malware data is present, use this search:
| datamodel Malware Malware_Attacks search
To verify that events are being accelerated by the data model correctly, use this search (be careful not to search across all time):
| tstats summariesonly=true count from datamodel=Malware by user
For more information on distributed namespaces, see "Tscollect" and "Data Model" in the Splunk Search Reference Manual for more information about data models and namespaces.
Useful searches/Troubleshooting
| Troubleshooting Task | Search/Action | Expected Result |
|---|---|---|
| Verify that you have data from your network device(s) | sourcetype=<your_sourcetype_for_your_data> | Returns data from your network device(s). |
| Verify that malware data is tagged and indexed in Splunk | tag=malware tag=attack or | datamodel Malware Malware_Attacks search |
Returns all malware data from your device(s) |
| Verify that malware data is normalized to the Common Information Model properly | | datamodel Malware Malware_Attacks search | table signature src src_nt_domain_src_user dest dest_nt_domain user | Returns a list of events and the specific malware data fields populated from your device(s) |
Additional Information
For more information about using the Malware Center dashboard, see "Malware Center dashboard" in the Splunk App for Enterprise Security User Manual.
Malware Search
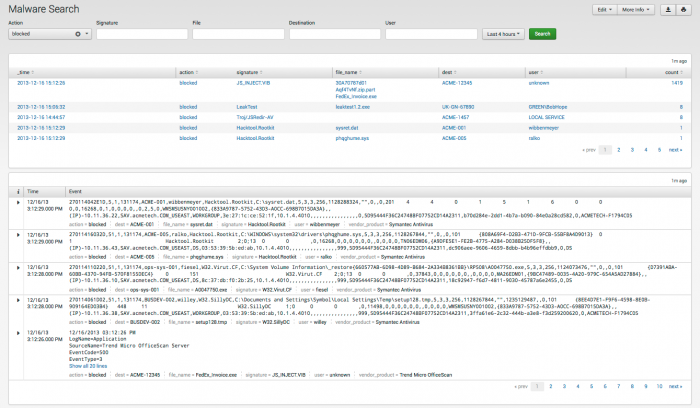
The Malware Search dashboard helps you to search for malware-related events in your environment.
Use the filters at the top of the dashboard to find specific events. Text field values must be lowercase text.
Relevant data sources
Relevant data sources for the Malware Search dashboard include firewall devices, intrusion detection software, system logs, and related network sources indexed by Splunk.
How to configure this dashboard
1. Index relevant data sources from a device, application, or system in Splunk.
2. Map the data to the Authentication data model. See the Common Information Model Add-on Manual for more information. The Common Information Model fields bunit and category are derived by automatic identity lookup, and do not need to be mapped directly.
3. Tag the data with "malware" AND "attack".
Dashboard description
The Malware Search dashboard data is derived from the Malware data model and accelerated automatically.
To verify that authentication data is present, use this search:
| datamodel Malware Malware_Attacks search
To verify that events are being accelerated by the data model correctly, use this search (be careful not to search across all time):
| tstats summariesonly=true count from datamodel=Malware by user
For more information on distributed namespaces, see "Tscollect" and "Data Model" in the Splunk Search Reference Manual for more information about data models and namespaces.
Useful searches/Troubleshooting
| Troubleshooting Task | Search/Action | Expected Result |
|---|---|---|
| Verify that you have data from your network device(s) | sourcetype=<your_sourcetype_for_your_data> | Returns data from your network device(s). |
| Verify that malware data is tagged and indexed in Splunk | tag=malware tag=attack or | datamodel Malware Malware_Attacks search |
Returns all malware data from your device(s) |
| Verify that malware data is normalized to the Common Information Model properly | | datamodel Malware Malware_Attacks search | table signature src src_nt_domain_src_user dest dest_nt_domain user | Returns a list of events and the specific malware data fields populated from your device(s) |
Additional Information
For more information about using the Malware Search dashboard, see "Malware Search dashboard" in the Splunk App for Enterprise Security User Manual.
Malware Operations
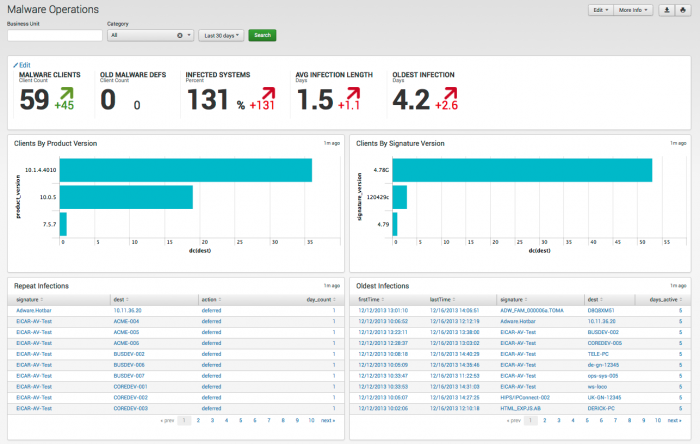
The Malware Operations dashboard tracks the status of the endpoint protection products deployed in your environment. It helps to identify systems that need updates or modifications to their endpoint protection software.
Relevant data sources
Relevant data sources for the Malware Operations dashboard include firewall devices, intrusion detection software, system logs, and related network sources indexed by Splunk.
How to configure this dashboard
1. Index relevant data sources from a device, application, or system in Splunk.
2. Map the data to the Malware data model. See the Common Information Model Add-on Manual for more information. The Common Information Model fields bunit and category are derived by automatic identity lookup, and do not need to be mapped directly.
3. Tag the data with "malware" AND "attack" OR
"endpoint" AND "application" AND "report " AND "version" AND "error".
Dashboard description
Malware Operations dashboard data is derived from the Malware data model and accelerated automatically. To verify that authentication data is present, use this search:
| datamodel Malware Malware_Attacks search
To verify that events are being accelerated by the data model correctly, use this search (be careful not to search across all time):
| tstats summariesonly=true count from datamodel=Malware by user
For more information on distributed namespaces, see "Tscollect" and "Data Model" in the Splunk Search Reference Manual for more information about data models and namespaces.
Useful searches/Troubleshooting
| Troubleshooting Task | Search/Action | Expected Result |
|---|---|---|
| Verify that you have data from your network device(s) | sourcetype=<your_sourcetype_for_your_data> | Returns data from your network device(s). |
| Verify that malware operations data is tagged and indexed in Splunk | tag=malware tag=attack tag=signature or | datamodel Malware Malware_Attacks search |
Returns all malware data from your device(s) |
| Verify that malware data is normalized to the Common Information Model properly | | datamodel Malware Malware_Attacks search | table signature product_version signature_version | Returns a list of events and the specific malware operations data fields populated from your device(s) |
Additional Information
For more information about using the Malware Operations dashboard, see "Malware Operations dashboard" in the Splunk App for Enterprise Security User Manual.
System Center
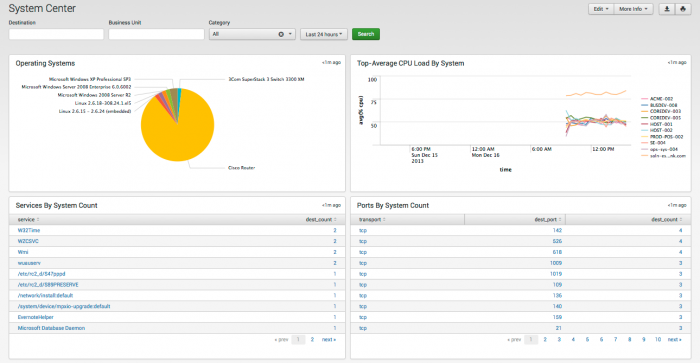
The System Center dashboard shows information related to endpoints, beyond the information reported by deployed anti-virus or host-based IDS systems.
Endpoint statistics and information gathered by Splunk appear on this dashboard, including system configuration and performance metrics for hosts, such as memory usage, CPU usage, and disk usage.
Relevant data sources
Relevant data sources for the System Center include all network data indexed by Splunk that provides usage data, CPU, disk, and memory usage, information about operating systems, listening port data, and services.
How to configure this dashboard
1. Index relevant data sources from a device, application, or system in Splunk.
2. Map the data to the Application State data model. See the Common Information Model Add-on Manual for more information. The Common Information Model fields bunit and category are derived by automatic identity lookup, and do not need to be mapped directly.
3. Tag the data with "os" AND "report" AND "version" AND "listening port".
Dashboard description
System Center dashboard data is derived from the Application_State data model and accelerated automatically. To verify that application state data is present, use this search:
| datamodel Application_State All_Application_State search
To verify that events are being accelerated by the data model correctly, use this search (be careful not to search across all time):
| tstats summariesonly=true count from datamodel=Application_State by user
For more information on distributed namespaces, see "Tscollect" and "Data Model" in the Splunk Search Reference Manual for more information about data models and namespaces.
Useful searches/Troubleshooting
| Troubleshooting Task | Search/Action | Expected Result |
|---|---|---|
| Verify that you have data from your network device(s) | sourcetype=<your_sourcetype_for_your_data> | Returns data from your network device(s). |
| Verify that local system data exists | | datamodel Application_State All_Application_State search | Returns local systems data |
| Verify that systems data is normalized to the Common Information Model properly | | datamodel Application_State All_Application_State search | table action dest status user | Returns a list of events and the specific system data fields populated from your device(s) |
Additional Information
For more information about using the System Center dashboard, see "System Center dashboard" in the Splunk App for Enterprise Security User Manual.
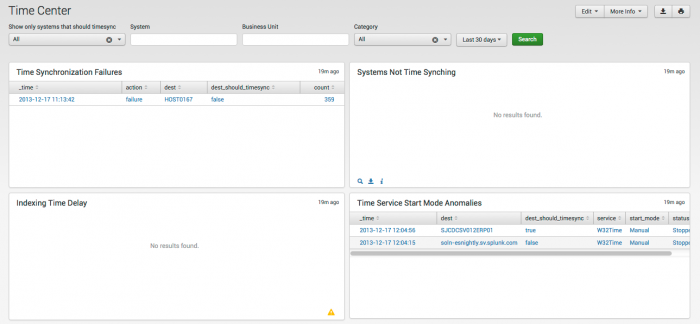
Time Center
The Time Center dashboard helps ensure the integrity of data by identifying hosts that are not correctly synchronizing their clocks.
Relevant data sources
Relevant data sources for the Time Center dashboard includes applications and devices that provide time synchronizing data in your environment.
How to configure this dashboard
1. Index relevant data sources from a device, application, or system in Splunk.
2. Map the data to the Performance data model. See the Common Information Model Add-on Manual for more information. The Common Information Model fields bunit and category are derived by automatic identity lookup, and do not need to be mapped directly.
3. Tag the data with "time" AND "synchronize" AND "failure".
Dashboard description
Time Center dashboard data is derived from the Performance data model and accelerated automatically.
To verify that authentication data is present, use this search:
| datamodel Performance Timesync search
To verify that events are being accelerated by the data model correctly, use this search (be careful not to search across all time):
| tstats summariesonly=true count from datamodel=Performance by user
For more information on distributed namespaces, see "Tscollect" and "Data Model" in the Splunk Search Reference Manual for more information about data models and namespaces.
Useful searches/Troubleshooting
| Troubleshooting Task | Search/Action | Expected Result |
|---|---|---|
| Verify that you have data from your network device(s) | sourcetype=<your_sourcetype_for_your_data> | Returns data from your network device(s). |
| Verify that time services data is indexed in Splunk | tag=time tag=synchronize tag=failure or | datamodel Performance Timesync search |
Returns time services data from your device(s) |
| Verify that time services data is normalized to the Common Information Model properly | | datamodel Performance Timesync search |table time dest app | Returns a list of events and the specific time data fields populated from your device(s) |
Additional Information
For more information about using the Time Center dashboard, see "Time Center dashboard" in the Splunk App for Enterprise Security User Manual.
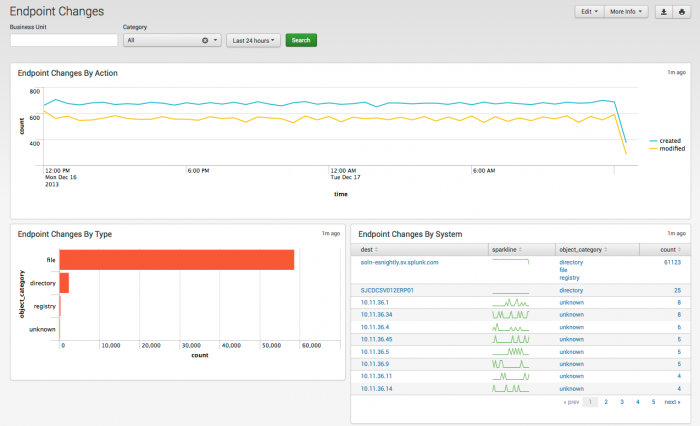
Endpoint Changes
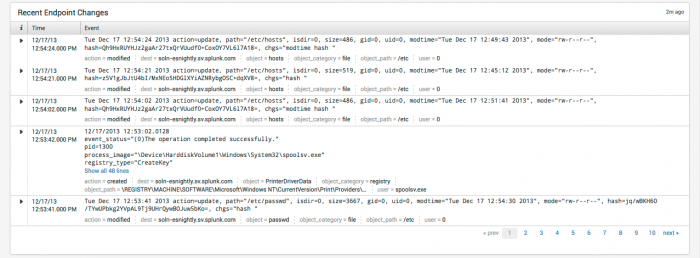
The Endpoint Changes dashboard summarizes the results from the Splunk change monitoring system, which detects file-system and registry changes.
Note: Only systems running a Splunk forwarder will report this information.
Relevant data sources
Relevant change data for the Endpoint Changes dashboard includes the Splunk change monitoring system, along with system log files and devices that detect endpoint or registry changes in the environment.
How to configure this dashboard
1. Index relevant data sources from a device, application, or system in Splunk.
2. Map the data to the Change Analysis data model. See the Common Information Model Add-on Manual for more information. The Common Information Model fields bunit and category are derived by automatic identity lookup, and do not need to be mapped directly.
3. Tag the data with "fs_notification" OR "WinRegistry".
Dashboard description
Endpoint Changes dashboard data is derived from the Change_Analysis data model and accelerated automatically.
To verify that authentication data is present, use this search:
| datamodel Change_Analysis Endpoint_Changes search
To verify that events are being accelerated by the data model correctly, use this search (be careful not to search across all time):
| tstats summariesonly=true count from datamodel=Change_Analysis by user
For more information on distributed namespaces, see "Tscollect" and "Data Model" in the Splunk Search Reference Manual for more information about data models and namespaces.
Useful searches/Troubleshooting
| Troubleshooting Task | Search/Action | Expected Result |
|---|---|---|
| Verify that you have data from your network device(s) | sourcetype=<your_sourcetype_for_your_data> | Returns data from your network device(s). |
| Verify that endpoint change data is indexed in Splunk | tag=fschchange tag=synchronize or datamodel Change_Analysis Endpoint_Changes search |
Returns endpoint change data from your device(s) |
| Verify that systems data is normalized to the Common Information Model properly | | datamodel Change_Analysis Endpoint_Changes search |table action dest object status user | Returns a list of events and the endpoint change data fields populated from your device(s) |
Additional Information
For more information about using the Endpoint Changes dashboard, see "Endpoint Changes dashboard" in the Splunk App for Enterprise Security User Manual.
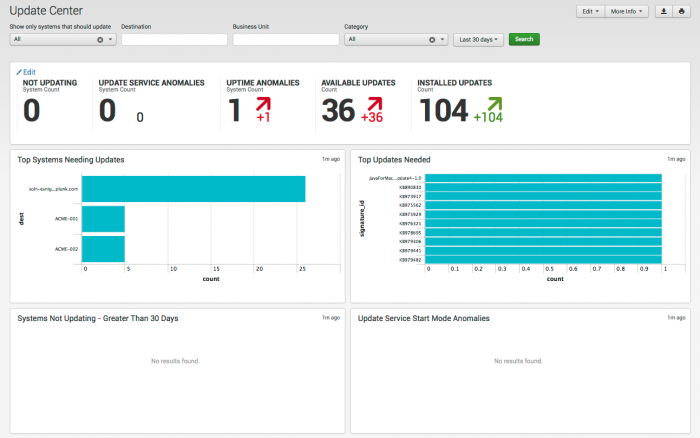
Update Center
The Update Center dashboard provides additional insight into systems by displaying those systems that have not been updated or are running intermittently (or not at all).
Relevant data sources
Relevant data sources for the Update Center dashboard include the Splunk change monitoring system, along with system log files and devices that detect endpoint or software updates in the environment.
How to configure this dashboard
1. Index relevant data sources from a device, application, or system in Splunk.
2. Map the data to the Updates data model. See the Common Information Model Add-on Manual for more information. The Common Information Model fields bunit and category are derived by automatic identity lookup, and do not need to be mapped directly.
3. Tag the data with "os" AND "update" AND "status" AND "error".
Dashboard description
The Patch/Update Center dashboard data is derived from the Performance data model and accelerated automatically.
To verify that authentication data is present, use this search:
| datamodel Application_State Services search
To verify that events are being accelerated by the data model correctly, use this search (be careful not to search across all time):
| tstats summariesonly=true count from datamodel=Application_State by user
For more information on distributed namespaces, see "Tscollect" and "Data Model" in the Splunk Search Reference Manual for more information about data models and namespaces.
Useful searches/Troubleshooting
| Troubleshooting Task | Search/Action | Expected Result |
|---|---|---|
| Verify that you have data from your network device(s) | sourcetype=<your_sourcetype_for_your_data> | Returns data from your network device(s). |
| Verify that local system data exists | tag=os tag=update tag=status tag=error or | datamodel Application_State Services search |
Returns local patch/update data |
| Verify that patch/update data is normalized to the Common Information Model properly | | datamodel Application_State Services search |table dest, app, signature, status | Returns a list of events and the patch/update data fields populated from your device(s) |
Additional Information
For more information about using the Update Center dashboard, see "Update Center dashboard" in the Splunk App for Enterprise Security User Manual.
Update Search
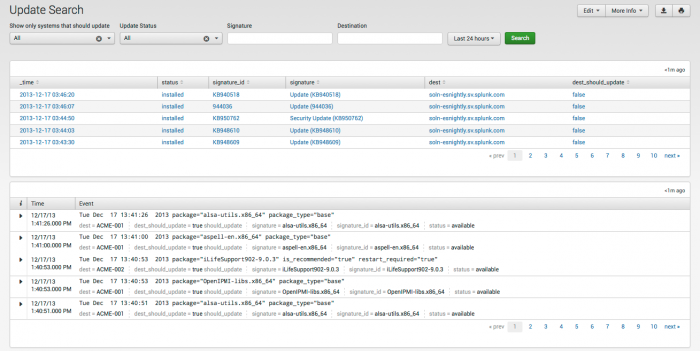
The Update Search dashboard shows updates and patches by package and/or device. Use this dashboard to filter and search for patch and update information in your environment.
Use the filters at the top to search for a particular type of event. Click an items to drill down to the raw data represented here.
Relevant data sources
Relevant data sources for the Update Search dashboard include the Splunk change monitoring system and devices that detect updates in the environment.
How to configure this dashboard
1. Index relevant data sources from a device, application, or system in Splunk.
2. Map the data to the Updates data model. See the Common Information Model Add-on Manual for more information. The Common Information Model fields bunit and category are derived by automatic identity lookup, and do not need to be mapped directly.
3. Tag the data with "os" AND "update" AND "status".
Dashboard description
Update Search dashboard data is derived from the Updates data model and accelerated automatically.
To verify that authentication data is present, use this search:
| datamodel Updates Updates search
To verify that events are being accelerated by the data model correctly, use this search (be careful not to search across all time):
| tstats summariesonly=true count from datamodel=Updates by user
For more information on distributed namespaces, see "Tscollect" and "Data Model" in the Splunk Search Reference Manual for more information about data models and namespaces.
Useful searches/Troubleshooting
| Troubleshooting Task | Search/Action | Expected Result |
|---|---|---|
| Verify that you have data from your network device(s) | sourcetype=<your_sourcetype_for_your_data> | Returns data from your network device(s). |
| Verify that update data is indexed in Splunk | tag=os tag=update tag=status or | datamodel Updates Updates search |
Returns update data from your device(s) |
| Verify that update data is normalized to the Common Information Model properly | | datamodel Updates Updates search | table dest, app, signature, status | Returns a list of events and the update data fields populated from your device(s) |
Additional Information
For more information about using the Update Search dashboard, see "Update Search dashboard" in the Splunk App for Enterprise Security User Manual.
| Access dashboards | More Network dashboards |
This documentation applies to the following versions of Splunk® Enterprise Security: 3.1, 3.1.1, 3.2, 3.2.1, 3.2.2
 Download manual
Feedback submitted, thanks!