Incident Review dashboard
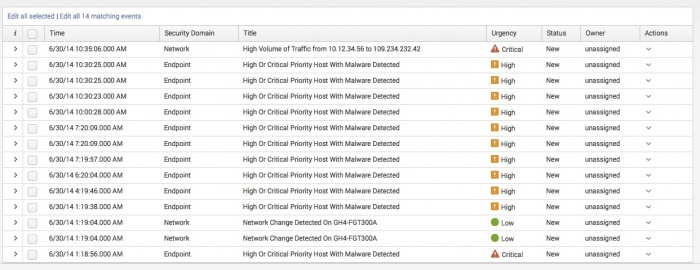
The Incident Review dashboard displays notable events and their current status. As an analyst, you will use the dashboard to gain insight into the severity of events occurring within your system or network. You will use the dashboard views to triage new notable events, examine event details, and assign events to analysts for review and resolution.
Notable event
A notable event is an object that represents one or more anomalous incidents that the Enterprise Security application (ES app) has detected across the data sources. For example, a notable event might represent:
- The repeated occurrence of an abnormal spike in network usage over a period of time
- A single occurrence of unauthorized access to a system
- The result of a correlated search that looks for relationships between data points
The Incident Review dashboard surfaces these notable events, categorizing them by potential severity so you can quickly triage and resolve issues.
Use the Incident Review dashboard
The incident review process is a workflow through which you move notable events and track the actions analysts take to resolve the issues that triggered an event.
Incident review workflow
An example of the workflow for performing incident review:
- An administrative analyst monitors the Incident Review dashboard, sorting and performing high-level triaging on newly created notable events.
- Where an event warrants investigation, the admin assigns the notable event to another analyst to initiate the event’s journey through the resolution workflow.
- The analyst changes the status of the event from New to In Progress, and begins investigating the cause of the notable event, collecting and solving any issues that may have occurred.
- After the analyst is satisfied that the conditions of the notable event have been addressed, the notable event’s status is set to Resolved. The analyst then assigns it to a final user for verification.
- The final owner of the event examines the changes made to resolve the issue(s), and sets the status to Closed.
The Enterprise Security app tracks all incident review activity for auditing, and makes this information available on the Incident Review Audit dashboard.
Triage notable events
To perform an initial triage, you need to identify and sort notable events based upon categories and criticality before reviewing and assigning them. The Incident Review dashboard makes available several tools to facilitate the task of triaging notable events, including search filters, correlation search details, history, and contributing events.
Use the search filters and time range selector to narrow your focus your attention on specific notable events.
| Filter by | Description | Action |
|---|---|---|
| Urgency | Filter by the Urgency status of the notable events | Table: select to filter out |
| Status | Filter by the workflow status of the notable events | Drop-down: select to filter in |
| Owner | Filter by the workflow owner of the notable events | Drop-down: select to filter in |
| Security Domain | Filter by the security domain of the notable events | Drop-down: select to filter in |
| Name | Filter by string. | Text field. Wildcard with an asterisk (*) |
| Search | Filter with direct splunk search language queries (free-form entry). | Text field. Wildcard with an asterisk (*) |
| Time | Select a time range to filter results | Drop-down: select to set time-range |
| Tag | Filter notable events by tag. To tag notable events, see Tagging notable events in this topic. | In the Search field, type tag=tag_name to filter by tag.
|
After the filtering is complete, the events can be reviewed. Choosing an individual notable event will expand the event and present additional fields:
- Correaltion Search: A link to the Edit Correlation Search page where the correlation search associated with the event is defined. Review the correlation search parameters to understand why the notable event was created.
- History: A search link that displays the change history for that notable event.
- Contributing Events: A search link that displays the results of a drill-down search. The drill-down search is designed to show the events that triggered the notable event creation.
Work with notable events
When the ES app creates and indexes a notable event, it includes a number of unique fields to provide details and context about the event: Urgency, Status and Owner
| Urgency |
Urgency is calculated based on the severity of the event and the priority of the asset or identity on which the event occurred. Urgency levels for notable events are:
The urgency of a notable event can be changed by the security analyst. The ability to modify the urgency of an event can be disabled. See "Configure Incident Review Settings" in the Installation and Configuration manual. |
|---|---|
| Status |
A new notable event is created with a status of New. As a notable event moves through its resolution workflow, its status changes to reflect the actions the owner of the event is taking to address the event.
You can change the default values for status names and workflow progression. See "Configure notable events" in the Installation and Configuration manual. |
| Owner |
The owner of an event is the user currently reviewing or taking action to resolve an event. Owner options for notable events are:
|
To act upon events and move them through their resolution workflow:
1. Use the checkboxes to select one or more events upon which you wish to act, and select Edit all selected. Alternatively, click Edit all ## matching events to act upon all events displayed in the filter results.
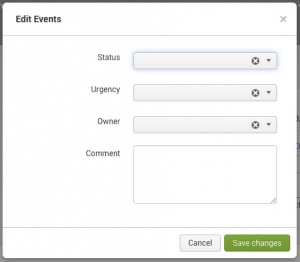
2. The ES app opens the Edit Events window. Adjust field contents to reflect the actions you’ve taken relative to the event.
3. Add an optional Comment to describe the actions taken. In a Security Information and Event Management (SIEM) environment, comments are mandatory for changing the characteristics of a security event. This creates a more complete audit record and removes the need to ask the analysts to explain their actions. You can adjust the ES app configurations to make the Comment field mandatory. See "Configure Incident Review Settings" in the Installation and Configuration manual.
4. Save the changes
- If the modified event is not displayed when the Incident Review dashboard refreshes, review the filter settings at the top of the dashboard. Example: The filter is set to "New" after the event is changed to "In Progress".
The Actions menu offers additional workflow actions for indexed events.
- Suppress events to/from ###:
- Creates a New Notable Event Suppression and populates the key fields from the notable event. An Expiration Time field is available to define a time limit for the suppression filter. If the time limit is met, the suppression filter is disabled. See "Create a suppression from Incident Review" in this manual.
Tagging notable events
The notable events displayed on the Incident Review dashboard can be tagged for additional identification and to simplify searching. Key notable event fields such as Title, Status, and Owner offer the option to create new tags through the field action menu labeled Edit Tags. After the tags are created, use the dashboard Search filter to find tagged events by typing tag=tag_name.
| Security Posture dashboard | Manual notable event creation |
This documentation applies to the following versions of Splunk® Enterprise Security: 3.1, 3.1.1, 3.2, 3.2.1, 3.2.2


 Download manual
Feedback submitted, thanks!