Advanced Filter
Some dashboards in the Splunk App for Enterprise Security include the Advanced Filter, which can filter items out of dashboard views ("per-panel filtering") making it easier to find those events that require investigation.
- If an event is determined to be a threat, use the Advanced Filter editor to add the item to your blacklist of known threats.
- If an event is not a threat, you can add it to your whitelist to remove it from the dashboard view.
Note: The Advanced Filter icon won't appear unless the user has permission. To configure this permission, see Configure users and roles in the Installation and Configuration manual.
Whitelist events
After you have determined that an event is not a threat, you can whitelist the event to hide it from the dashboard view. The summary statistics will continue to calculate whitelisted items, but they will not be displayed in the dashboard.
To whitelist an event
Use the Advanced Filter to "whitelist" or filter events on a dashboard.
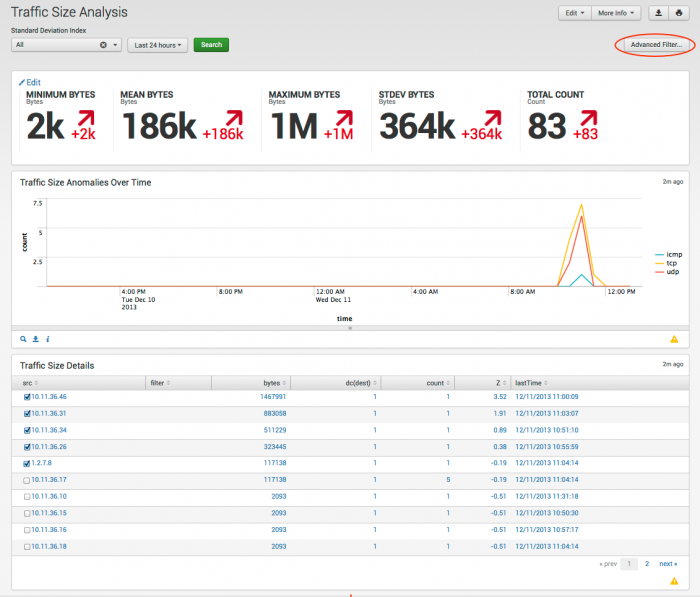
For example, to whitelist traffic events on the Traffic Size Analysis dashboard:
1. Use the checkboxes to select the items to filter.
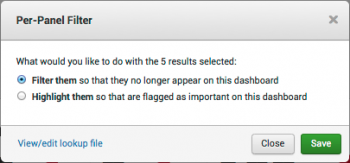
2. Click Advanced Filter... to display options for events that can be filtered in this dashboard.
3. Select the radio button to filter events on this dashboard.
4. Click Save when you are done.
Note: The filtered events are not removed from the calculations for this dashboard, only removed from the view.
After an item is added to the whitelist, it is considered good (not a threat) and will no longer show up on the Traffic Size Analysis dashboard.
To remove an item from the whitelist:
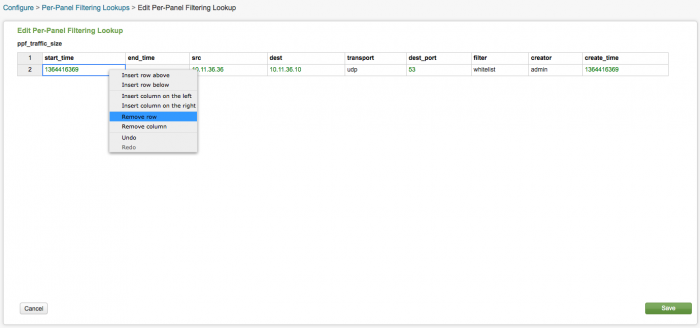
1. Click Advanced Filter and then View/edit filtered entries to see the list of entries currently being filtered.
2. Right-click on a cell in the list to view the context menu.
3. Remove the row containing the whitelisted item.
4. Click Save.
Blacklist events
An event can also be blacklisted. Blacklisting an item means that you have identified an event that is known to be malicious, or thought to communicate with a command and control server that is known to be malicious. Any time the event or string shows up in the data, you will want to investigate the system, the user associated with the system, and the web activity to understand the nature and possible proliferation of the threat. The process of blacklisting an event or string is similar to the process of whitelisting.
To blacklist an event
To backlist a traffic event on the Traffic Size Analysis dashboard, do the following:
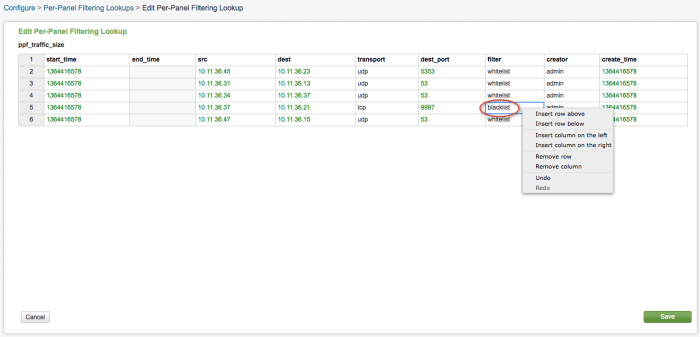
1. Click View/edit filtered entries to see the list of entries currently being filtered.
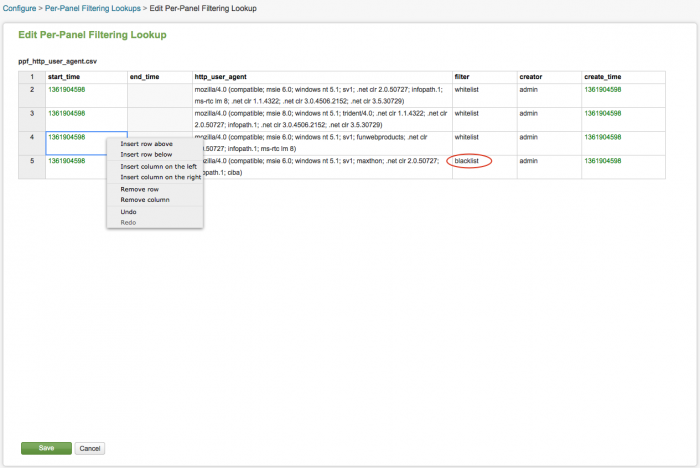
2. Right-click on a cell in the list to view the context menu. Type "blacklist" in the cell under the filter column.
Need updated screen here
3. Click Save.
Edit the per-panel filter list
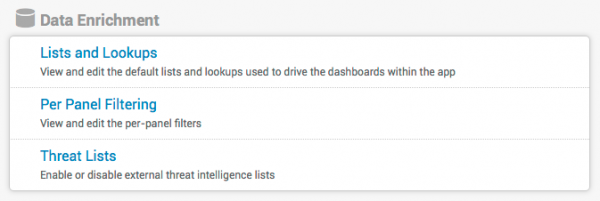
To see your current list of filters by panel, click Per Panel Filtering in Data Enrichment on the Configuration page.
Per-Panel Filtering Lookups shows the current list of per panel filters in your environment.
Click an event in the list to open the editor and view or modify that filter. The name for that filter (for example, ppf_http_user_agent.csv) is shown in the upper left-hand corner.
Need updated screen here
- An event has been added to the "whitelist" will be listed here.
- To edit a field, select a cell and begin typing.
- To insert or remove a row or column in the filter, right-click on the field for edit options.
- Remove a row to add that item back into the panel view and remove it from the whitelist.
- To "blacklist" an item, use the editor to add a new row to the table and use "blacklist" in the "filter"column.
Click Save when you are finished.
Audit per-panel filters
Changes to the per-panel filters are logged in the per-panel filtering audit logs. Per-panel filters are modified by the per-panel filter module and the lookup editor.
To review the audit logs for the per-panel filters, use this search:
eventtype="ppf_updates" | table user namespace lookup_file
The list of modified per-panel filters is shown.
Need updated screen here
Click on a row in the table to drill down to the raw events.
| Add a custom dashboard | Asset and Identity correlation |
This documentation applies to the following versions of Splunk® Enterprise Security: 3.1, 3.1.1, 3.2, 3.2.1, 3.2.2, 3.3.0, 3.3.1, 3.3.2, 3.3.3


 Download manual
Feedback submitted, thanks!