Audit dashboards
The Audit domain helps to validate the security of the data within Enterprise Security. Audit and data protection includes resources for ensuring that forwarders are functioning, that data has not been tampered with, that data is secured in transmission, and that the incidents detected by the rules are being reviewed.
Incident Review Audit
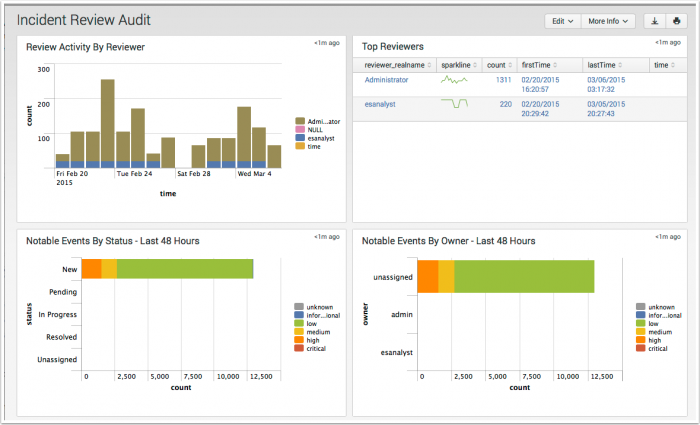
The Incident Review Audit dashboard provides an overview of incident review activity. The panels display how many incidents are being reviewed and by which user, along with a list of the most recently reviewed events. The metrics on this dashboard allow security managers to review the activities of analysts.
| Panel | Description |
|---|---|
| Review Activity by Reviewer | Displays the numbers of events reviewed by each user. This panel is useful for determining which user is performing the incident reviews and if the total number of incidents reviewed is changing over time. The drilldown redirects the page to a search with all activity by the selected reviewer. |
| Top Reviewers | Displays the top users that have performed incident reviews. The panel includes details for each user, including the date they first performed an incident review, the date they last performed a review, and the total number of incidents reviewed. The drilldown redirects the page to a search with all activity by the selected reviewer. |
| Notable Events By Status - Last 48 Hours | Displays the status, count, and urgency for all notable events in the last 48 hours. This panel is useful for determining if the incident review users are keeping up with incidents, or whether a backlog of unreviewed incidents is forming. The drilldown redirects the page to the Incident Review dashboard and searches on the selected urgency and status over the lat 48 hours. |
| Notable Events By Owner - Last 48 Hours | Displays the owner, count, and urgency for all notable events in the last 48 hours. This panel is useful for determining how many events are assigned to a user and the urgency of the events. The drilldown redirects the page to the Incident Review dashboard and searches on the selected urgency over the lat 48 hours. |
| Recent Review Activity | Displays the 10 most recent incident review changes. The drilldown redirects the page to a search with the selected rule id. |
Data sources
The reports in the Incident Review Audit dashboard reference fields in the notable index and the incident review objects in a KVStore collection.
Suppression Audit
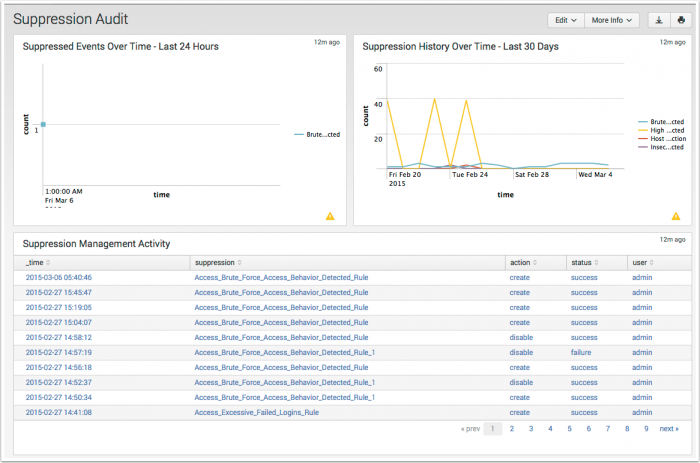
The Suppression Audit dashboard provides an overview of notable event suppression activity. This dashboard shows how many events are being suppressed and by whom so that notable event suppression can be audited and reported on.
The metrics on this dashboard allow security managers to review the activities of analysts, which is useful for tuning correlation searches.
| Panel | Description |
|---|---|
| Suppressed Events Over Time - Last 24 Hours | Displays notable events suppressed in the last 24 hours. |
| Suppression History Over Time - Last 30 Days | Displays the history of suppressed notable events. |
| Suppression Management Activity | Displays suppression management activity for the time period. |
| Expired Suppressions | Displays expired suppressions. |
Data sources
The reports in the Suppression Audit dashboard reference events in the Notable index.
Per-Panel Filter Audit
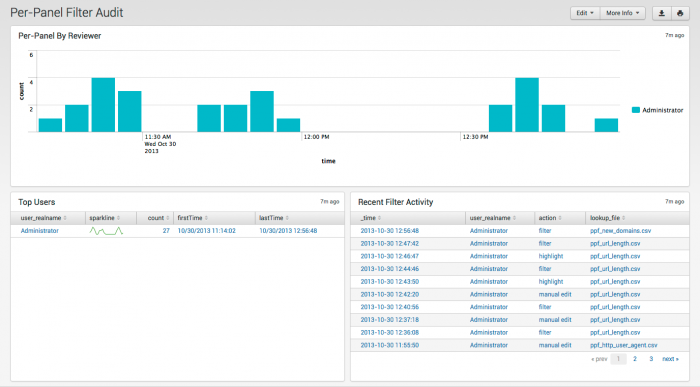
The Per-Panel Filter Audit dashboard provides information about the filters currently in use in your deployment.
The following table describes the panels for this dashboard.
| Panel | Description |
|---|---|
| Per-Panel By Reviewer | Displays the count of updates to per-panel filters by user |
| Top Users | Shows users, sparkline for trends, number of views, and first and last time viewed. |
| Recent Filter Activity | Activity by time, user, action, and filename |
Threat Intelligence Audit
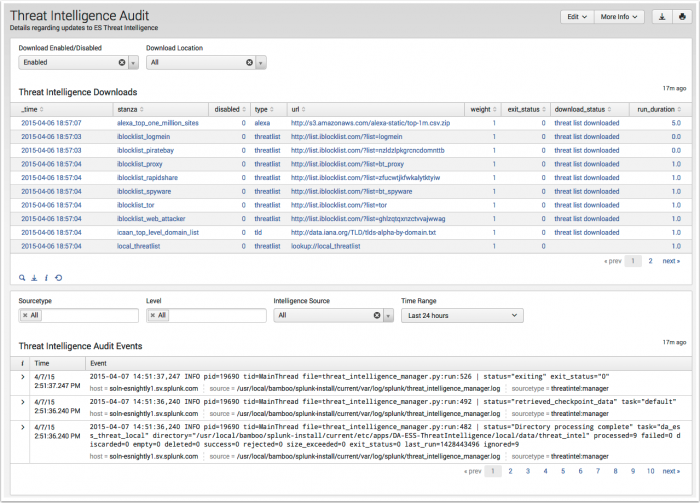
The Threat Intelligence Audit dashboard tracks and displays the current status of all threat intelligence sources. As an analyst, you can review this dashboard to determine if threat sources are current, and troubleshoot connection issues.
| Panel | Description |
|---|---|
| Threat Intelligence Downloads | Displays the status of all threat sources defined on the Threat Intelligence Downloads configuration page. Use the filters to sort by status or download location. |
| Threat Intelligence Audit Events | Displays the log events relating to threat intelligence downloads configured from the Threat Intelligence Downloads and Threat Intelligence Manager configuration pages. Use the filters to sort and filter the events displayed. |
A system message is automatically created if a threat source download fails.
Data sources
The reports in the Threat Intelligence Audit dashboard reference events in the _internal index and state information from the /services/data/inputs/threatlist REST endpoint.
Content Profile
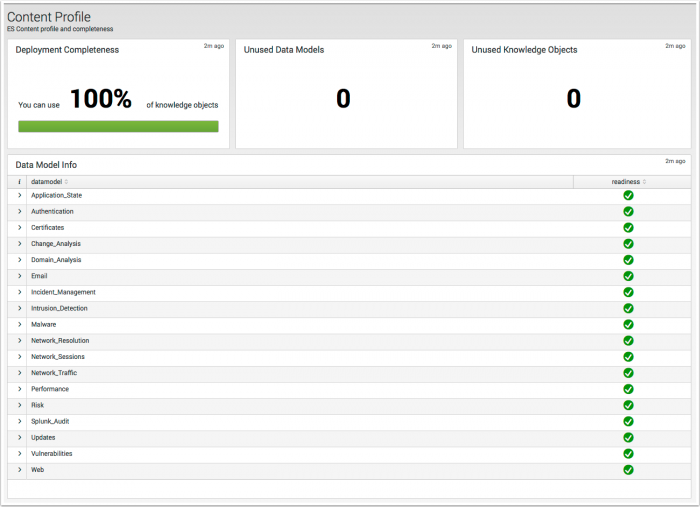
The Content Profile dashboard compares the knowledge objects provided in the Enterprise Security app to the data models the objects require, and expresses the results as a deployment completeness percentage.
| Panel | Description |
|---|---|
| Deployment Completeness | Displays the percentage of knowledge objects provided in the Enterprise Security app that reference populated data models. To achieve 100%, each data model referenced by a knowledge object must have data. |
| Unused Data Models | Displays the number of unpopulated data models. If Unused Data Models is selected, the Data Model Info view will display only the unpopulated data models. |
| Unused Knowledge Objects | Displays the number of unavailable knowledge objects due to an unpopulated data model. |
| Data Model Info | Displays each of the data models by name. A selection drop down displays a detailed break down of the object type and name. Example: Selecting the Application_State data model displays over 20 unique searches, and panels by app. |
Data sources
The reports in the Content Profile dashboard examines the knowledge objects in Enterprise Security and determines which data models they use. If the referenced data model contain events, the knowledge objects are considered available and complete. The analysis of a knowledge object is limited to the data model name only, and does not extend to the data model objects referenced in a knowledge object. It is possible to achieve 100% completeness and have a search or view display no data. To verify there is accelerated data in a data model, use the "Data Model Audit" dashboard. To verify the data model objects referenced by a dashboard panel, see "Dashboard Requirements Matrix" in the Installation and Configuration Manual.
Data Model Audit
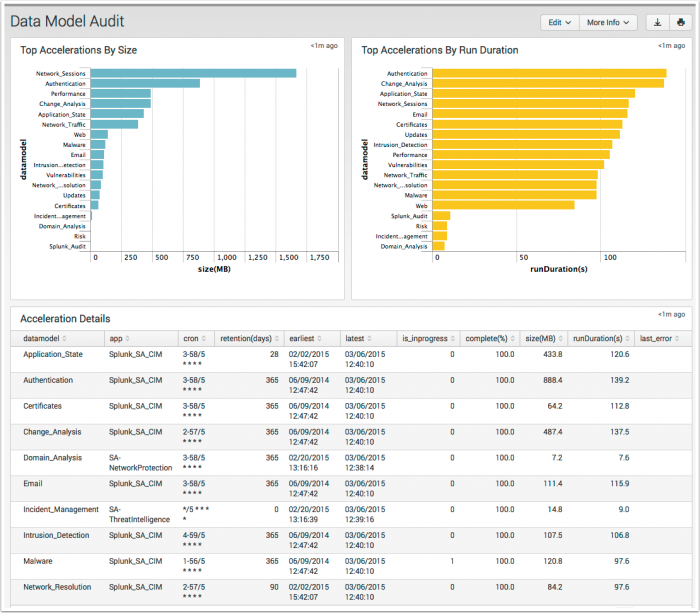
The Data Model Audit dashboard displays information about the state of data model accelerations in your environment.
| Field Name Panel | Description |
|---|---|
| Top Accelerations By Size | Displays a descending view of the accelerated data models by MB on disk |
| Top Accelerations By Run Duration | Displays a descending view of the accelerated data models by the time spent on running acceleration tasks. |
| Accelerations Details | Displays a table view of the accelerated data models with additional information. |
Data sources
The reports in the Data Model Audit dashboard reference fields in the Splunk Audit data model. For a list of data model objects and constraints, see "Splunk Audit Logs" in the Common Information Model Add-on Manual.
Forwarder Audit
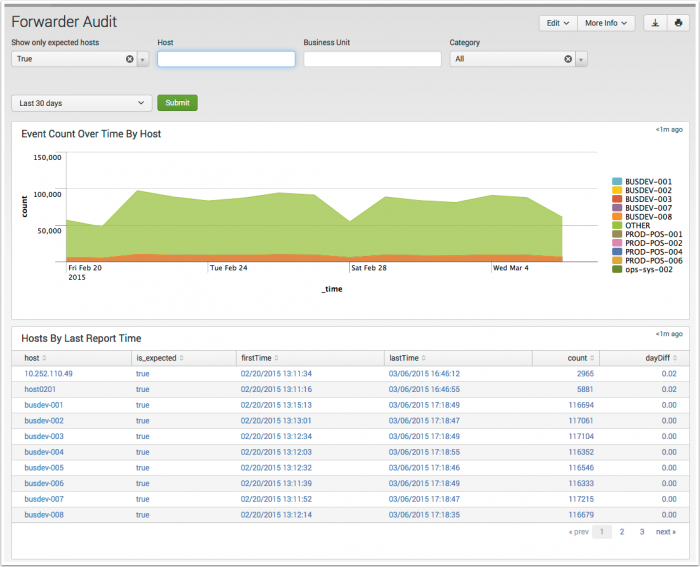
The Forwarder Audit dashboard reports on hosts forwarding data to Splunk Enterprise.
Use the search filters and time range selector to focus on groups of, or an individual forwarder.
| Filter by | Description | Action |
|---|---|---|
| Show only expected hosts | An expected host is a host defined in ES by the expected host field is_expected in the Asset table. |
Drop-down by expected host. |
| Host | Filter by the host field in the Asset table. | Text field. Wildcard with an asterisk (*) |
| Business Unit | Filter by the business unit bunit field in the Asset table. |
Text field. Wildcard with an asterisk (*) |
| Category | Filter by the category field in the Asset table. | Drop-down by category. |
| Panel | Description |
|---|---|
| Event Count Over Time By Host | |
| Hosts By Last Report Time | |
| Splunkd Process Utilization | Displays the resource utilization of the forwarder's Splunk daemon splunkd.
|
| Splunk Service Start Mode | Displays the host names that are forwarding events, but are not configured to have splunkd start on boot.
|
Data sources
Relevant data sources for the Forwarder Audit dashboard include *** data from all forwarders in your Splunk environment.
The Application_State data model. See the Common Information Model Add-on Manual for more information. The Common Information Model fields bunit and category are derived by automatic identity lookup, and do not need to be mapped directly.
Indexing Audit
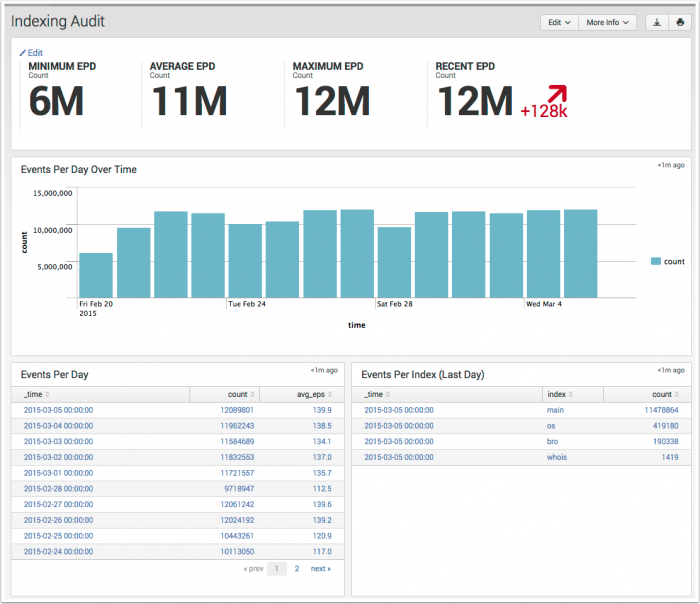
The Indexing Audit dashboard is designed to assist administrators in estimating the volume of event data being indexed by Splunk Enterprise. The dashboard displays are scoped to EPD (Events per day) as a metric to track the event volume per index, and the rate of change in the total event counts per index over time. The EPD is for event counts, and is not related to the Volume Per Day metric used in licensing.
| Panel | Description |
|---|---|
| Key Indicators | The key indicators on this dashboard are scoped to "All-Time," and not the "Last 24 hours" seen on other dashboards. |
| Events Per Day Over Time | Displays a column chart representing the event counts per day. |
| Events Per Day | Displays a table representing event counts per day and the average eps. |
| Events Per Index (Last Day) | Displays a table of event counts per index for the last day. |
Data sources
The reports in the Indexing Audit dashboard reference data generated by the saved search: Audit - Events Per Day - Lookup Gen, and stored within a KVStore collection.
Search Audit
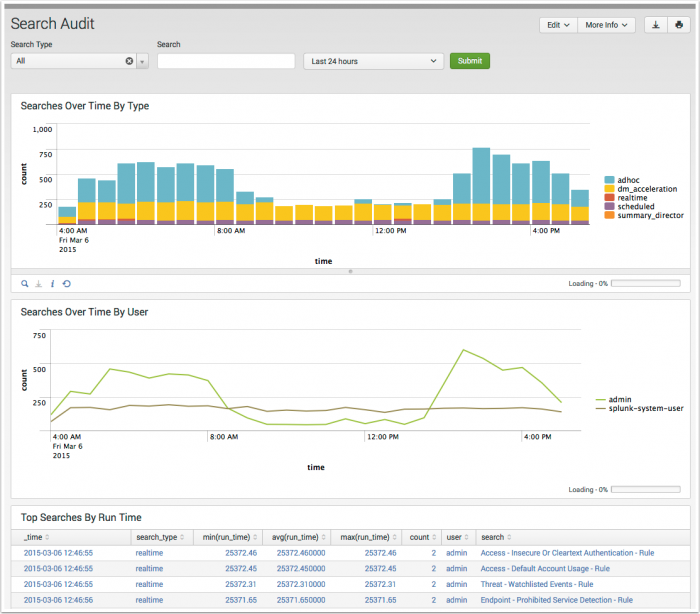
The Search Audit dashboard provides information about the searches being executed in Splunk Enterprise. This dashboard is useful for identifying long running searches, and tracking search activity by user.
| Panel | Description |
|---|---|
| Searches Over Time by Type | Shows the number of searches executed over time by type, such as ad-hoc, scheduled, or real-time. Helps determine whether Splunk's performance is being affected by excessive number of searches. |
| Searches Over Time by User | Shows the number of searches executed by each user. Helps determine when a particular user is executing an excessive number of searches. The splunk-system-user is the name of the account used to execute scheduled searches in Splunk Enterprise.
|
| Top Searches by Run Time | Lists the most expensive searches in terms of duration. Helps to identify specific searches that may be adversely affecting Splunk performance. |
Data sources
The reports in the Search Audit dashboard reference scheduled search auditing events from the audit index.
View Audit
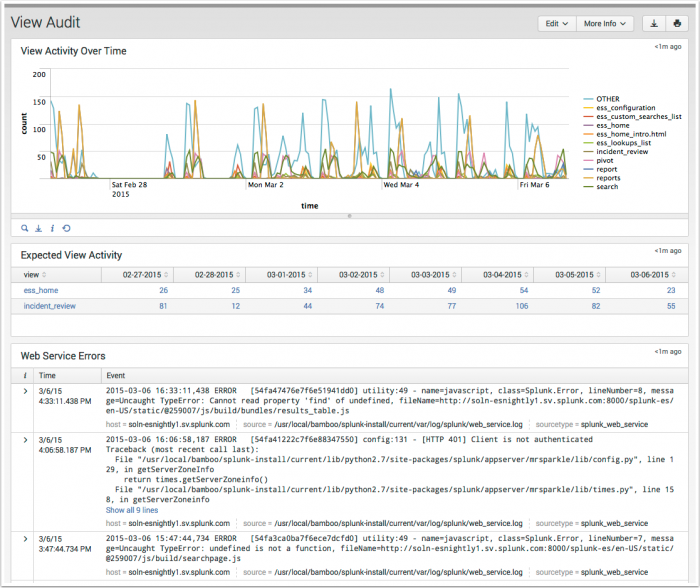
The View Audit dashboard reports on the most active views in Enterprise Security. View Audit enables tracking of views are being accessed on a daily basis, and helps to identify any errors triggered when users review dashboard panels.
| Panel | Description |
|---|---|
| View Activity Over Time | Displays the Enterprise Security views that have the greatest access counts over time. The drilldown redirects to a search view of all page activity for the time selected. |
| Expected View Activity | Lists the views set up in the Expected View list -- these are views that you want to review on a daily basis for your deployment. Select a dashboard to see details in the Expected View Scorecard panel below. Use Configure > Lists and Lookups > Expected Views for setting up the Expected View list. |
| Web Service Errors | Displays errors that occurred while rendering the web interface. Helps identify custom views that contain errors or an underlying issue that need to be escalated to Splunk. |
Data sources
The reports in the View Audit dashboard reference fields in the Splunk Audit data model. For a list of data model objects and constraints, see "Splunk Audit Logs" in the Common Information Model Add-on Manual.
| Additional Network dashboards | Create new correlation searches |
This documentation applies to the following versions of Splunk® Enterprise Security: 3.3.0, 3.3.1, 3.3.2, 3.3.3
 Download manual
Feedback submitted, thanks!