Threat Intelligence
Threat Activity
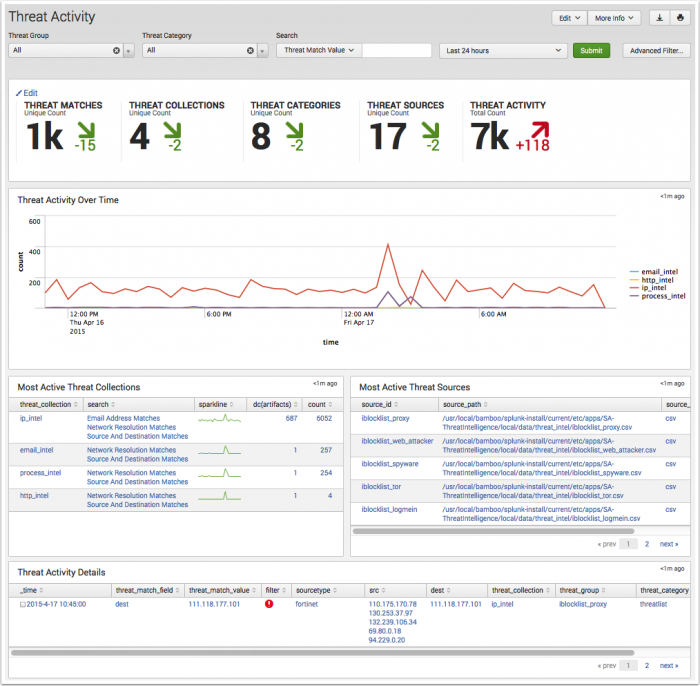
The Threat Activity dashboard provides information on threat activity by matching the threat intelligence source content to events found in Splunk Enterprise. Use the filters at the top of the page to scope all dashboard panels to the chosen Threat Group, Threat Category, threat content key values, and Time Range. The filter settings do not effect the key indicators.
Dashboard filters
Use the available dashboard filters to refine the results displayed on the dashboard panels. The filters do not apply to key security indicators.
| Filter by | Description |
|---|---|
| Threat Group | A named group or entity representing a known threat, such as a malware domain. |
| Threat Category | A category of threat, such as advanced persistent threat, financial threat, or backdoor. |
| Search | Used for searching on a value related to fields: Destination, Sourcetype, Source, Threat Collection, Threat Collection Key, Threat Key, Threat Match Field, and Threat Match Value. |
Dashboard panels
| Panel | Description |
|---|---|
| Key Indicators | Displays the metrics relevant to the dashboard sources over the past 24 hours. Key indicators represent summary information, and appear at the top of the dashboard. See "Key indicators" in this manual. |
| Threat Activity Over Time | Displays the count of events by all threat collections over the selected time. The drilldown redirects the page to a search with the selected threat collection and scoped to the selected time frame. To review the threat collections, see "Supported threat intelligence groups" in the Installation and Configuration Manual. |
| Most Active Threat Collections | Displays the top threat collections by event matches over the selected time, with a sparkline representing peak event matches. The drilldown redirects the page to a search with the selected threat collection. |
| Most Active Threat Sources | Displays the top threat sources over the selected time by event count matches. The drilldown redirects the page to a search with the selected threat source. |
| Threat Activity Details | Displays a breakout of the most recent threat matches. Use the event selection box Threat Activity Details with the Advanced Filter option to:
|
Data sources
The reports in the Threat Activity dashboard use fields in the Threat_Intelligence data model. Relevant data sources include threat source event matches in the threat_activity index along with the associated threat artifacts.
Troubleshooting
1. This dashboard references data from the Threat Intelligence data model. Without the applicable data, the dashboards will remain empty.
2. Use the Open in Search link available in the lower left corner of a dashboard view to perform a direct search against the data model. The New Search dashboard also exposes the search commands and objects used to populate the view.
3. Determine if any data required for a dashboard is available in the data model.
- a. Determine the data model objects used by a dashboard:
Data model and objects Threat Intelligence data model objects:
- Threat_activity.threat_collection
- Threat_activity.threat_collection_key
- Threat_activity.threat_key
- Threat_activity.threat_match_field
- Threat_activity.threat_match_value
- Threat_activity.dest
- Threat_activity.src
- Threat_activity.orig_sourcetype
- b. Use the data model and data model object to search for events in the data model:
Action Search Expected Result Verify the data is normalized to the Common Information Model | datamodel data_model_name root_object_name search | table _time, sourcetype, root_object_name.* Example: | datamodel Network_Traffic All_Traffic search | dedup sourcetype | table _time, sourcetype, All_Traffic.*
Returns a list of sourcetypes and the data model objects and fields populated by that sourcetype.
4. Validate the data model is being accelerated.
- In the Splunk App for Enterprise Security, browse to Audit > Data Model Audit. Review the Acceleration Details panel for information about the data model acceleration status.
- Note: For more information about data model acceleration and the Enterprise Security App, see "Data models in the Enterprise Security app" in the Installation and Configuration Manual.
Threat Artifacts
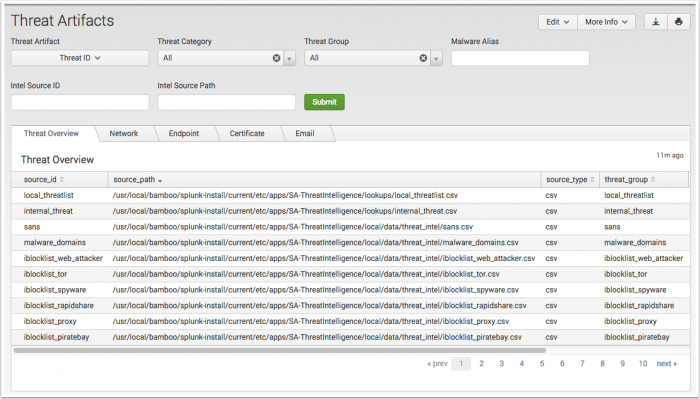
The Threat Artifacts dashboard provides a single location to explore and review threat content sourced from all configured threat download sources. It provides additional context by showing all related threat artifacts to a user specified threat source or artifact.
The dashboard offers multiple selection filters and tabs to isolate the threat content.
| Filter by | Description |
|---|---|
| Threat Artifact | A collection of objects grouped by the threat collection, such as network, file, and service. |
| Threat Group | A named group or entity representing a known threat, such as a malware domain. |
| Threat Category | A category of threat, such as advanced persistent threat, financial threat, or backdoor. |
Begin by changing the Threat Artifact: drop-down to the access other defined data filters.
| Threat Artifact selection | Filter by Text: (*) wildcard defaulted | Filter by Drop-down |
|---|---|---|
| Threat ID | Malware Alias, Intel Source ID, and Intel Source Path | Threat Category Threat Group |
| Network | IP, Domain | HTTP. Select from: Referer: User Agent, Cookie, Header, Data, or URL and add a string to search. |
| File | File Name, File Extension, File Path, and File Hash | |
| Registry | Hive, Path, Key Name, Value Name, Value Type, and Value Text | |
| Service | Name, Descriptive Name:, Description:, and Type | |
| User | User, Full Name, Group Name, and Description | |
| Process | Process, Process Arguments, Handle Names, and Handle Type | |
| SSL | Serial Number, Subject, Issuer, Validity not After, and Validity Not Before | |
| Address, Subject, and Body | ||
Use the tabs to review threat source context:
| Tab | Panels |
|---|---|
| Threat Overview | Endpoint Artifacts, Network Artifacts, Email Artifacts, Certificate Artifacts |
| Network | HTTP Intelligence, IP Intelligence, Domain Intelligence |
| Endpoint | File Intelligence, Registry Intelligence, Process Intelligence, Service Intelligence, User Intelligence |
| Certificate | Certificate Intelligence |
| Email Intelligence |
Data sources
The Threat Artifacts dashboard reference fields in the threat collection KVStore. Relevant data sources include threat sources such as STIX and OpenIOC documents.
Troubleshooting
1. This dashboard references data from the Threat Intelligence KVStore collections. Without the applicable data, the dashboards will remain empty.
2. The inputs configured in the Threat Intelligence Downloads and Threat Intelligence Manager pages are responsible for ingesting data from the threat sources and placing it into the KVStore collections. Use the Threat Intelligence Audit dashboard panel Threat Intelligence Audit Events to review the log entries created by the modular inputs.
| User Activity Monitoring | Advanced Threat dashboards |
This documentation applies to the following versions of Splunk® Enterprise Security: 3.3.0, 3.3.1, 3.3.2, 3.3.3


 Download manual
Feedback submitted, thanks!