Configure KPI thresholds with machine learning in ITSI
Instead of manually configuring threshold levels or selecting a threshold template that may not fit your historic KPI data, use machine learning-assisted thresholding to receive threshold recommendations tailored to your KPI data. Select the Use recommended thresholding configuration option to receive the optimal time-policies and threshold levels for your data generated by Splunk AI.
The recommended policy will have adaptive thresholding turned on by default, which automatically re-evaluates and updates threshold values as the KPI data changes over time. Recommendations are calculated using the standard deviation algorithm. For more information about adaptive thresholding, see Create adaptive KPI thresholds in ITSI.
Prerequisites
- Install Python for Scientific Computing version 3.0.0 or later in order to use this feature.
- Your KPI needs at least 7 days worth of backfilled data or display a historical pattern or trend in order to produce recommendations. For more information, see When to use adaptive thresholds.
Step 1: Select a KPI to configure with machine learning
- Select the relevant service from the Services page, and select the KPI tab.
- Expand the Thresholding panel for a service KPI and select Use Recommended Thresholding Configuration.
- Update the Thresholding Direction. The setting specifies the direction (increase, decrease, or both) that you want threshold level severities to follow. Splunk AI can automatically select the correct thresholding direction based on an analysis of your data.
Step 2: Select the KPI analysis window
- Update the Analysis Window, which is the time period over which your KPI data will be analyzed to detect patterns and behavior. The threshold values and time policies generated by Splunk AI will be based on the data available in this window. For the most accurate recommendations, select a time range that captures the typical behavior of the KPI.
Note: Selecting 7 days of data will help the algorithm detect daily patterns in KPI data. Selecting 30 days or more (14 days at minimum) helps the algorithm detect weekly patterns, in addition to daily patterns.
Step 3: View and configure threshold recommendations
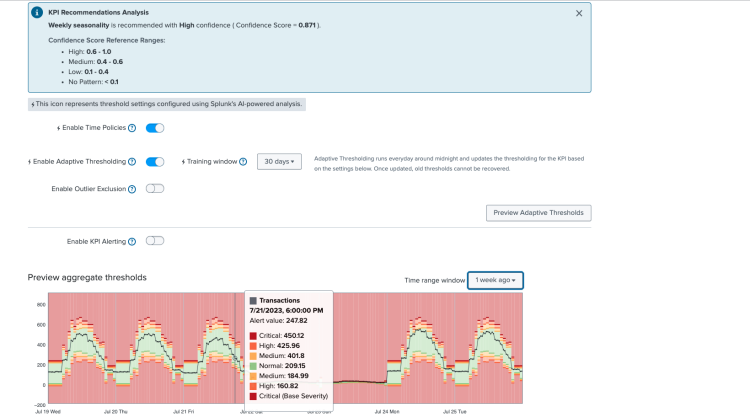
- Select Load Recommendations to analyze your data. The KPI Recommendations Analysis banner provides a summary of the recommended KPI time policy and threshold template based on machine learning-assisted analysis of your data.
- View the recommended time policies in the Configure Thresholds for Time Policies panel. The threshold values are updated based on the trends in your KPI data. For example, if your KPI behavior changes on Saturdays and Sundays between 5am and 1pm, the threshold values are updated to account for that behavior.
- (Optional) Adjust or customize the recommended threshold values based on your needs. For more information, see Configure KPI thresholds in ITSI.
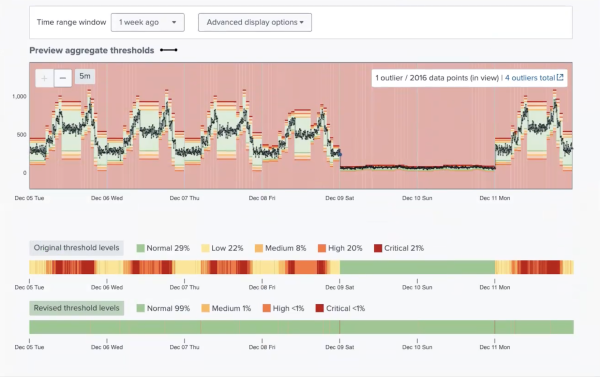
Note: The outlier exclusion toggle is automatically turned on to exclude outliers in your data caused by any abnormal behavior, such as service outages. This setting prevents any outlier data from skewing threshold calculations.
Step 4: Save your threshold settings
Select Save to save your changes. You can also save the threshold recommendations in your service as part of a service template to quickly deploy the threshold settings to other KPIs.
Next steps
- After you configure KPI thresholds, you can set up alerts to notify you when aggregate KPI severities change. ITSI generates notable events in Episode Review based on the alerting rules you configure. For information, see Receive alerts when KPI severity changes in ITSI.
- Alternatively, you can set up Anomaly Detection for the KPI. Anomaly Detection uses machine learning algorithms to automatically detect abnormalities in KPI behavior and notify you in Episode Review. For more information, see Apply anomaly detection to a KPI in ITSI.
| Configure KPI thresholds in ITSI | Set KPI importance values in ITSI |
This documentation applies to the following versions of Splunk® IT Service Intelligence: 4.18.0, 4.18.1


 Download manual
Feedback submitted, thanks!