Configure episode information and episode dashboards in ITSI
Within an aggregation policy you can specify how you want episode information to appear in Episode Review. The Episode Information fields in an aggregation policy apply to all episodes grouped by that policy. The information is at the episode level and is separate from the information for the underlying notable events in the episode.
Changing a policy's episode information fields breaks all active episodes associated with that aggregation policy and starts a new episode. Make sure to carefully plan the timing of changes to these fields to mitigate potential risks associated with this behavior.
Configure episode information
- Within ITSI, click Configuration > Notable Event Aggregation Policies and open or create a policy.
- On the Filtering Criteria and Instructions tab, expand Episode Information.
- Configure the following settings for each episode field. The settings determines how different fields are displayed in episodes grouped by that policy:
Component Description Same as the first event Set the episode fields to the values from the first event in the episode. If there are multiple events in an episode with the same timestamp, the policy sorts them by milliseconds to determine the first event in an episode. Same as the last event Continually updates the episode fields as each new event enters the episode. If there are multiple events in an episode with the same timestamp, the policy sorts them by milliseconds to determine the last event in an episode. Static value Provide specific field values. If you select Static valuefor Episode Title or Episode Description, you can use a token such as %title% or %description% to insert the value of a field. If you provide a static value for Episode Instructions, you can include custom instructions in Markdown.Same as the lowest / highest severity (for episode severity) Continually updates the episode's severity field to match that of the event with the highest or lowest severity within the episode. All Events (for episode instructions) If you're ingesting event instructions through your correlation search, this setting adds a deduplicated list of instructions for each event included in the episode.
Add an episode dashboard
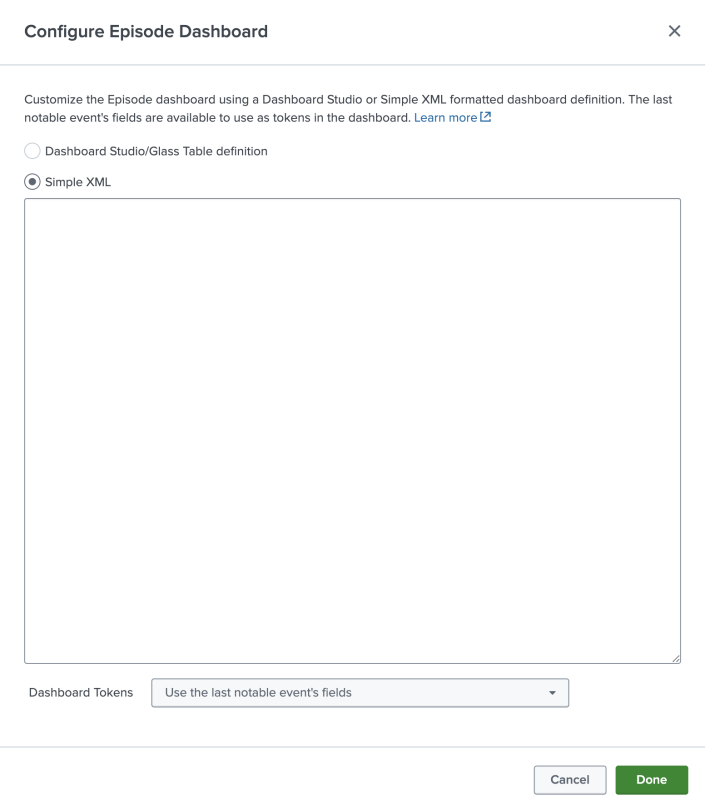
You can add a custom Dashboard Studio or Simple XML formatted dashboard to display in each episode grouped by an aggregation policy. Episode dashboards leverage Splunk Dashboard definitions. For formatting requirements and guidelines, see How the dashboard definition is structured in the source editor.
The first or last notable event fields are available to use as tokens in the dashboard:

Note: It is possible to utilize either the XML or JSON definition, but if you switch the dashboard type, the previous definition will be erased.
Tip: You can use the glass table JSON editor within ITSI to create and test your dashboard definitions before adding them to an aggregation policy. The glass table framework also leverages Splunk Dashboard definitions. Use the built-in capabilities of the glass table framework to build out your dashboard using KPI and service health score visualizations, then paste the finalized JSON into the aggregation policy dashboard configuration. For more information about building glass tables, see Overview of glass table editor in ITSI.
Once you add a dashboard, it appears on a separate Dashboard tab within each episode grouped by that policy. Analysts can reference this dashboard while investigating an episode in order to more efficiently troubleshoot and find root cause. You can add a maximum of one dashboard to an episode.
| Configure episode filtering and breaking criteria in ITSI | Configure episode action rules in ITSI |
This documentation applies to the following versions of Splunk® IT Service Intelligence: 4.17.0, 4.17.1, 4.18.0, 4.18.1, 4.19.0, 4.19.1, 4.19.2, 4.19.3, 4.19.4, 4.20.0, 4.20.1
 Download manual
Feedback submitted, thanks!