Buttercup Bank, a fictitious company created for illustrative purposes in this scenario, has a database that acts as the main data source for their mobile banking application. Lauren, an IT administrator at Buttercup Bank, uses Splunk IT Service Intelligence (ITSI) with Splunk App for Content Packs and the Content Pack for Monitoring and Alerting to monitor the service health and key performance indicators (KPI) of their mobile banking application.
To group related alerts generated by ITSI, Lauren does the following:
- Opens ITSI.
- Uses the entity discovery search function to verify that every active aggregation policy has a corresponding entity.
- Verifies that each of the following services are enabled:
- ITSI Event Analytics
- ITSI Alert Analytics
- ITSI Episode Analytics
- Selects Service Analyzer from the navigation bar.
- Applies filters for services, KPIs, and tags by selecting values for each of those fields.
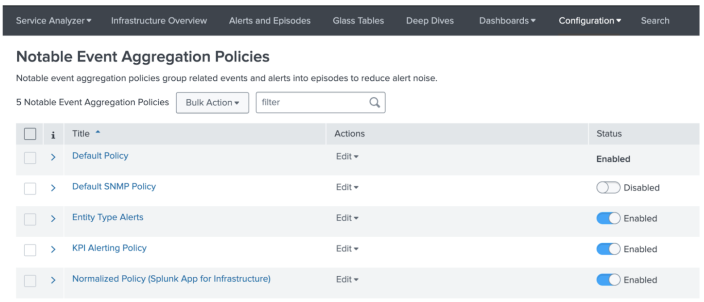
- Selects Configuration > Notable Event Aggregation Policies from the navigation bar.
- Enables the following aggregation policies by toggling their switches in the Status column:
- Entity Type Alerts
- KPI Alerting Policy
- Normalized Policy
- Selects the aggregation policy in the Title column to configure episode information for that policy.
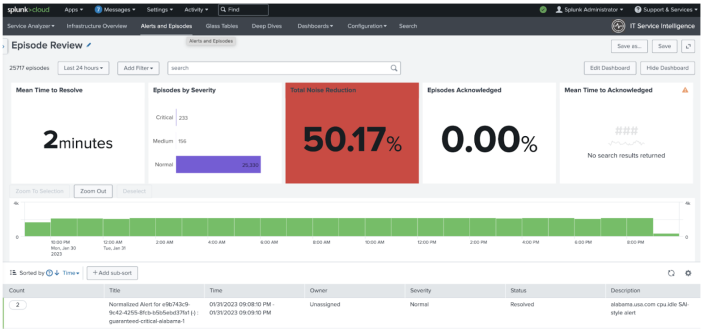
- Validates the output from the previous steps in this task by selecting Alerts and Episodes from the navigation bar. Lauren knows that notable events are stored in the
itsi_tracked_alertsindex. Alerts and Episodes now shows notable events grouped into deduplicated episodes in the ITSI Episode Review dashboard:
Gain a holistic understanding of issues in the ITSI environment
Lauren can use aggregation policies in ITSI to group alerts logically for faster tracking and troubleshooting while viewing details in the Service Analyzer and Alerts and Episodes Review dashboards that are part of ITSI.
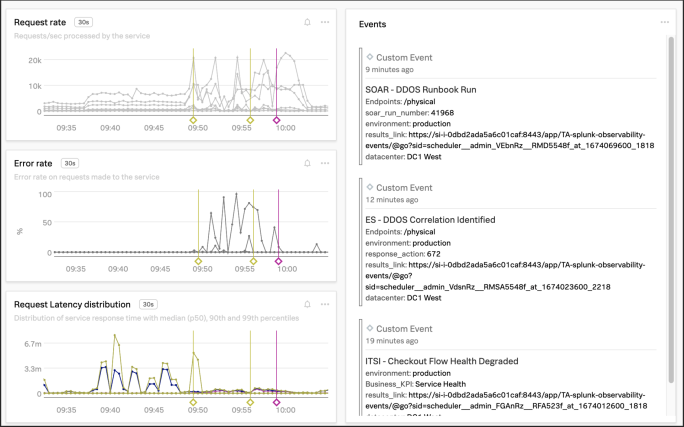
Lauren also knows that when Splunk Observability Cloud alerts are integrated with ITSI, a holistic understanding of Observability events, which are not the same as notable events tracked by ITSI, can help with problem diagnosis and troubleshooting.
Observability events provide context for point-in-time occurrences and display as overlays atop familiar dashboards, complete with event markers that show the start and end times of a given event.
To access event data by creating an alert sent directly from ITSI to Splunk Observability Cloud and leverage the capability of event analytics in ITSI, Lauren does the following:
- Installs Splunk Observability Cloud Alert Action for Splunk.
- Pastes the Observability API token into the Configuration field of that app.
- Runs a correlation search.
- Creates an alert based on search results.
- Chooses fields such as
app_name,eventtype, anddetectorIDfrom the search results to add as dimensions included with events. - Adds the alert action for the app to take, such as specifying that email alias
lauren@buttercupbankbe designated as an alert recipient.
Summary
In this scenario, Lauren reduced alert noise by using aggregation policies to group related alerts in ITSI, and integrated ITSI with Splunk Observability Cloud so as to have similar visibility into Observability events. As a result, Lauren can more efficiently monitor system health and key performance indicators for Buttercup Bank, reducing mean time to problem detection and mean time to problem resolution.
Learn more
| Subject | Resource |
|---|---|
| Aggregation policies and how they work | |
| Splunk Observability Cloud Alert Action for Splunk | |
| Different event types |
| Group similar events with Smart Mode in ITSI | Overview of Episode Review in ITSI |
This documentation applies to the following versions of Splunk® IT Service Intelligence: 4.16.0 Cloud only, 4.17.0, 4.17.1, 4.18.0, 4.18.1, 4.19.0, 4.19.1, 4.19.2, 4.19.3, 4.19.4, 4.20.0, 4.20.1


 Download manual
Feedback submitted, thanks!