Using Alerts in Splunk App for Infrastructure
Use alerts to monitor for and respond to specific behavior in your data. Analysis Workspace alerts are based on a specific chart. Alerts use a scheduled search of chart data, and trigger when search results meet specific conditions.
For a video demonstration about alerts, see Video: Setting up and using alerts.
You need admin permissions to create alerts in the workspace.
View alerts in the Analysis Workspace
In the Analysis Workspace, click the Alerts tab in the left Data panel to view a list of alerts that were created in the Analysis Workspace. The Alerts tab includes alerts that you created and alerts that have been shared with you. Alerts are listed in a tree structure according to the data source they use. Click a data source name to see a list of alerts that are based on it.
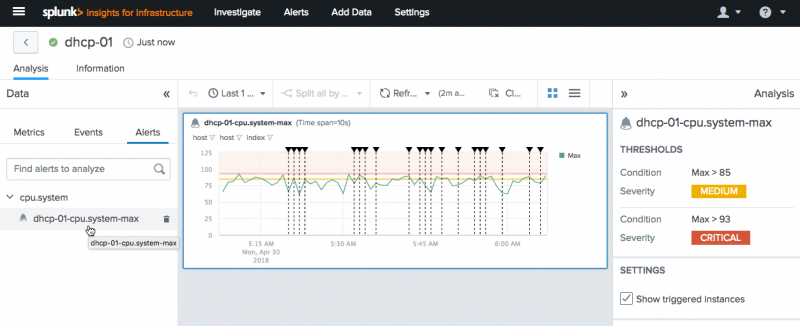
For example, the following image shows an Analysis Workspace alert for the cpu.system metric.
View alerts from the Alerts tab
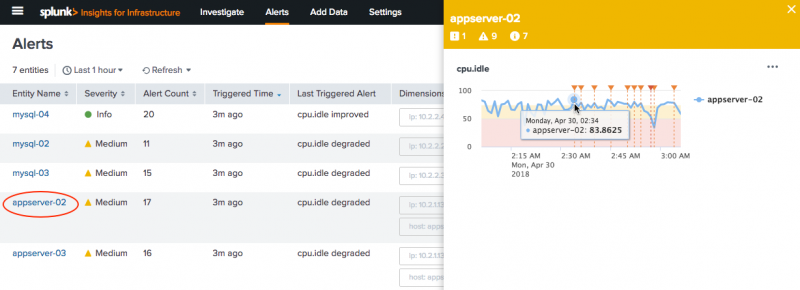
Click the Alerts tab in the menu bar to launch the Alerts page and to see a list of alerts that have been created in the Analysis Workspace. This page displays a list of the last 100 triggered alerts.
- When you click an alert, a slideout panel displays on the right of the screen with detailed information about the alert.
- In the slideout panel, click the
 to access the Investigate button to drilldown to the Analysis Workspace and investigate the alert further.
Parts of an alert
Alerts in the Analysis Workspace consist of an alert name, type ID, alert settings, trigger conditions, and trigger actions.
Trigger conditions
Set trigger conditions, or alert thresholds, to manage when an alert triggers. Trigger conditions consist of a data source, an aggregation to measure, and a threshold value.
Trigger actions
Configure trigger actions to manage alert responses. Select to notify someone by email based on trigger conditions. Specify a severity level to assign a level of importance to an alert. Severity levels can help you sort or filter alerts on the Alerts page. Available severity levels include Info, Low, Medium, High, and Critical.
Create an alert
- In the Main panel of the Analysis Workspace, select the chart for which you want to create an alert.
- Drag your cursor over a time area and data in the chart to pinpoint what data to use to create the alert.
- In the top-right corner of the chart, click the
 icon.
icon. - Click Create Alert to open the create alert dialog.
- A name for the alert is automatically generated for the alert, or you can enter a custom name for the alert following the character requirements.
- The Type Id and Metric are pre-populated, indicating the entity name and metric used.
- The details of the chart you selected to create an alarm are displayed.
- Set up trigger conditions. Trigger conditions include the aggregation, threshold, and throttle settings.
- Select notify options for when the alert triggers. Select to send an email and enter email address(es) for whom you want to notify if the alert triggers.
- Click Submit.
You have created an alert. To add the alert as a chart in the workspace, click Show Alert on the alert confirmation message.
Sending a notification when an alert triggers
When you create an alert, you can select to send a notification when the alert triggers. You can send an email notification, or use VictorOps to send an alert notification. Before sending a notification, the mail server settings must be configured by a user with admin privileges. See About Notifications in Splunk App for Infrastructure. This must be done by a user with admin privileges.
Edit an alert
Edit an alert to change threshold trigger conditions, or to add or change email recipients for notification for when the alert triggers.
- In the Analysis Workspace, in the alarm chart click the
 .
. - Click Edit Alert.
- Edit the alert by changing threshold values or email addresses.
- Click Submit.
Alert details
Select an alert in the workspace to view its details. Alert details show in the analysis panel. These details include the settings, trigger conditions, and severity level configured for the alert.
Show triggered instances to see when alert conditions are met. Triggered instances appear as ![]() annotations on the chart, and up to 100 annotations can display on the chart.
annotations on the chart, and up to 100 annotations can display on the chart.
To show triggered instances:
- In the Main panel, select the alert to show triggered instances for.
- In the Analysis panel under Settings, select Show triggered instances.
Triggered instance annotations appear at the time the alert triggers, not the precise time the alert threshold is crossed.
Use alert badges ![]() to gauge the alert severity level. To help you monitor alert activity, badge colors are based on the most recent severity level of a triggered alert.
to gauge the alert severity level. To help you monitor alert activity, badge colors are based on the most recent severity level of a triggered alert.
| Severity level | Badge color |
|---|---|
| No trigger | Gray |
| Info | Blue |
| Low | Green |
| Medium | Yellow |
| High | Orange |
| Critical | Red |
Example
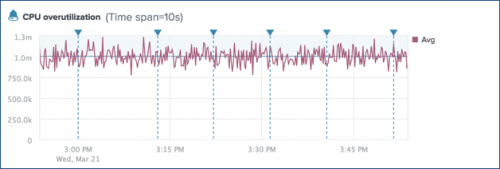
The following alert shows CPU overutilization for the system.cpu metric.
This alert is based on the aggregate average of system.cpu metric values. The blue alert badge indicates a severity level of Info. The horizontal blue line shows the alert threshold (1.0m). The ![]() annotations show triggered instances for the alert.
annotations show triggered instances for the alert.
| Analyze Entities and Groups with Splunk App for Infrastructure | Send an email alert notification in Splunk App for Infrastructure |
This documentation applies to the following versions of Splunk® App for Infrastructure (EOL): 1.2.0


 Download manual
Feedback submitted, thanks!