Analyze Entities and Groups with Splunk App for Infrastructure
Analyze performance metrics and log sources for a single entity, or a specific group of entities, using the Analysis Workspace. Understand why your infrastructure is performing the way it is, and quickly identify and respond to any issues or anomalies in your data.
Steps
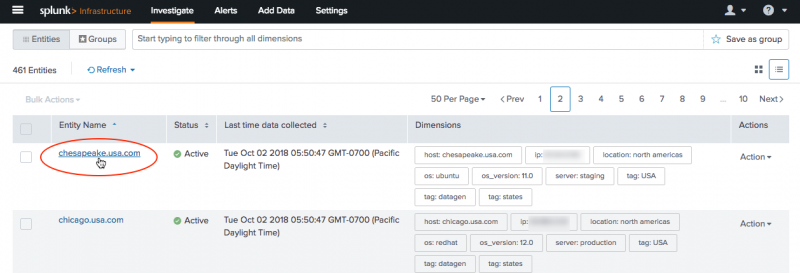
1. On the Investigate page, select the entity or group you want to analyze.
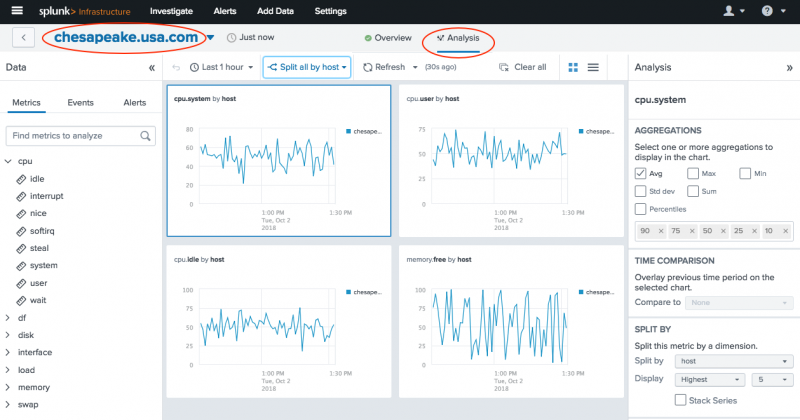
- If you select an entity, you will drill down to the Entity Overview page. Click the Analysis tab to access the Analysis Workspace.
- If you select a group, you will drill down to the Analysis Workspace.
2. Investigate your entities and groups.
- Determine poor performing entities for a set of metrics, or determine a point in time when multiple entities began performing in a similar way.
- Create alert conditions and search logs collected from your servers to perform root cause analysis.
- Select data sources to create interactive charts in the workspace.
- Apply filters and aggregations to gain insight into your system’s metrics and performance.
For more information about using the Analysis Workspace, see Using the Analysis Workspace in Splunk App for Infrastructure and About Analytics in the Analysis Workspace in Splunk Insights for Infrastructure.
| Monitor Entity Health with Splunk App for Infrastructure | Monitor and investigate alerts in Splunk App for Infrastructure |
This documentation applies to the following versions of Splunk® App for Infrastructure (EOL): 1.2.0, 1.2.1


 Download manual
Feedback submitted, thanks!