Monitor Entity Health with Splunk App for Infrastructure
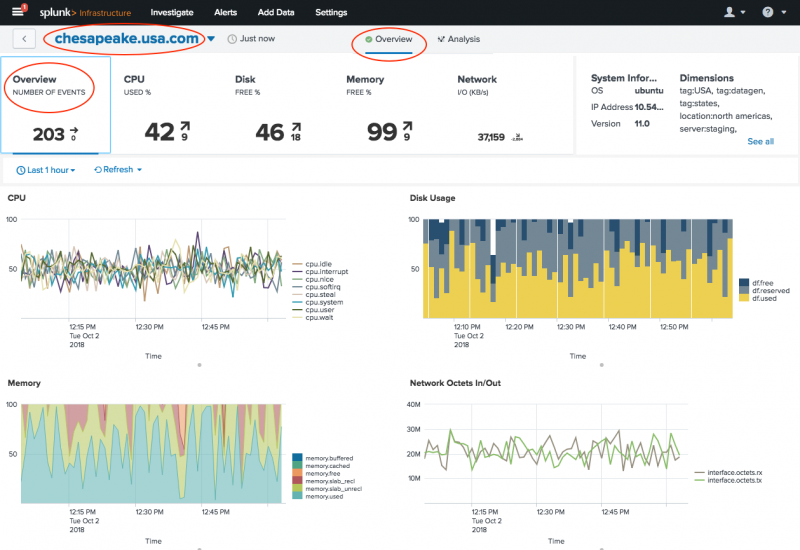
Monitor the overall health of an entity with the Entity Overview. The Entity Overview contains performance charts that give a quick view of the performance of Infrastructure entities.
The Entity Overview is available for the single entities only, and is not available for groups at this time.
Steps
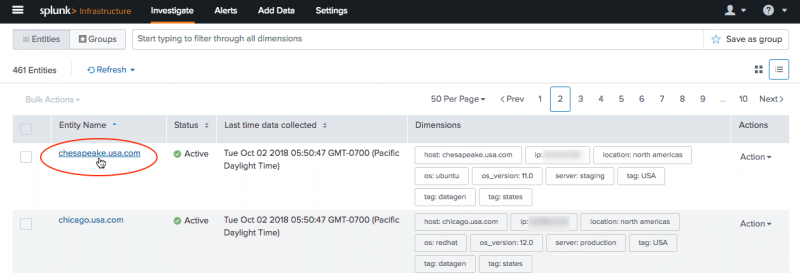
1. From the Investigate page, click an entity for which you want to view overall health.
This action drills down to the Entity Overview page.
2. On the Entity Overview page, view an overall summary of metrics being used by the entity, for example CPU, network, memory, disk, system information, dimensions and more. Each chart represents a metric area, and metrics vary depending on the operating system you are using.
- Click a metric area to display detailed charts for the selected metric area.
- Hover over an area or select a metric from list in the chart to display isolated metric information.
- For more information about using the Entity Overview, see Using the Entity Overview in Splunk App for Infrastructure.
| Get started using Splunk App for Infrastructure | Analyze Entities and Groups with Splunk App for Infrastructure |
This documentation applies to the following versions of Splunk® App for Infrastructure (EOL): 1.2.0, 1.2.1


 Download manual
Feedback submitted, thanks!