Monitor CPU usage using Splunk App for Infrastructure
There are multiple CPU metrics that provide insight into how your infrastructure is performing. CPU utilization metrics indicate the following:
- If a system is being over-utilized: If your system is being over-utilized, it does not have enough capacity for the CPU demand. A high cpu system, cpu user and low cpu.idle measurements indicate over-utilization.
- If a system is being under-utilized: Your system is expected to handle consistent workloads, but a high cpu.idle, low cpu.system and cpu.user measurements indicate under-utilization.
- Is disk I/O causing a bottleneck? A high cpu.wait measurement indicates that the CPU is unable to move on because it is waiting for a disk operation to finish.
A single Linux host is a server or entity. A group of Linux hosts is a logical clustering of entities based on a data center, operating system, or tier of infrastructure so that you can monitor them in aggregate.
Steps
Step 1: View your entities
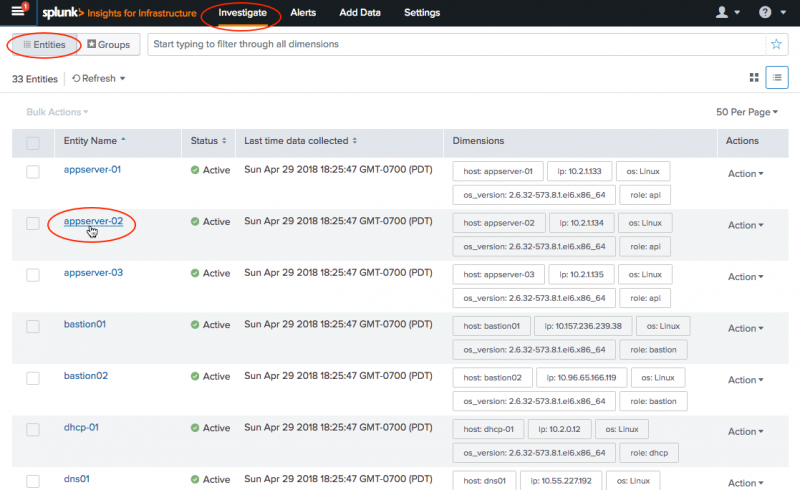
- Click the Investigate tab. The Investigate view displays the entities you have added. You can select to view your entities using the Infrastructure Overview (tile view) or List View.
Step 2: Explore Entities in the Entity Analysis Workspace
- Click the Entities button.
- Click the Entity Name for the host you want to explore. The Analysis Workspace displays.
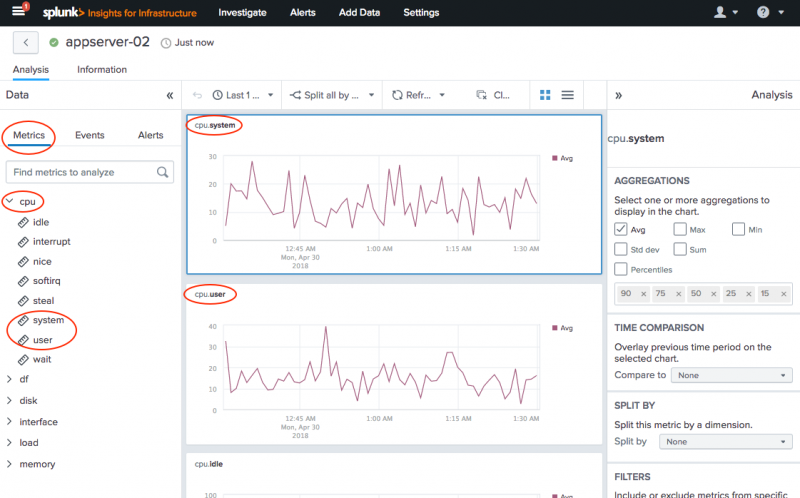
- Under Metrics, click cpu. This menu tree contains metrics used to analyze your system.
- Click user. A cpu:user chart is added to the workspace.
- Click system. A cpu:system chart is added to the workspace.
Step 3: View per CPU breakdown
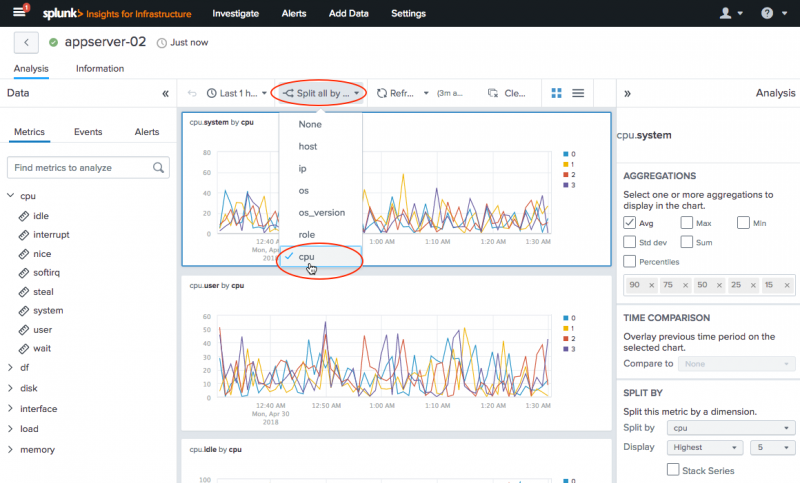
- In the workspace menu bar, select Split all by….
- Select cpu. This enables monitoring cpu usage per core for all your charts.
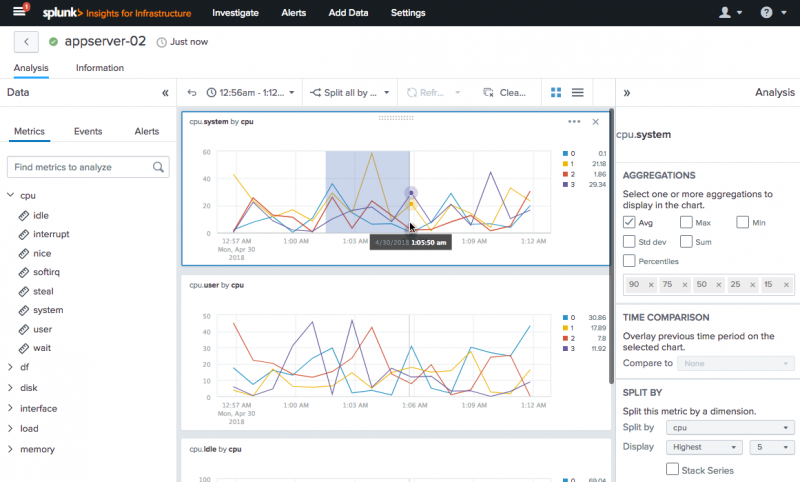
Step 4: Pinpoint a specific timerange to investigate
Summary
You now have a workspace that monitors your cpu usage for your single Linux hosts. On your workspace, you can also:
- Create alerts to notify you when conditions for critical issues are met. Admin privileges required to configure and manage alerts.
- Select the time period you want to display, from the last 15 minutes to the last 30 days.
- Use advanced aggregation and filtering options available in the Analysis panel.
- Select to view your charts by grid layout or stack layout
- Click the refresh button to refresh the screen.
| Monitor and investigate alerts in Splunk App for Infrastructure | Monitor CPU resource utilization using Splunk App for Infrastructure |
This documentation applies to the following versions of Splunk® App for Infrastructure (EOL): 1.2.0, 1.2.1, 1.2.2, 1.2.3


 Download manual
Feedback submitted, thanks!