Create and modify alerts in Splunk App for Infrastructure
Use alerts to monitor and respond to specific events. Alerts trigger when alert thresholds set for a metric on an entity or group meet specific conditions. Creating an alert includes:
- Create an alert, or multiple alerts for a group, entity or metric.
- Set thresholds for the alert to trigger.
- Set to receive an alert notification, such as by email or a VictorOps notification.
- Once an alert is created, and thresholds are met or exceeded, the alert displays in the Alerts overview.
- Open the alert chart to investigate alert instances.
- Edit alert settings.
Video: Setting up and using alerts
For a video demonstration about setting up and using alerts, see Video: Setting up and using alerts.
Create an alert
Prerequisites
Before creating an alert and sending an alert notification, the Notification server settings must be configured, as defined in Configure Alert Notification Settings in Splunk App for Infrastructure.
Steps
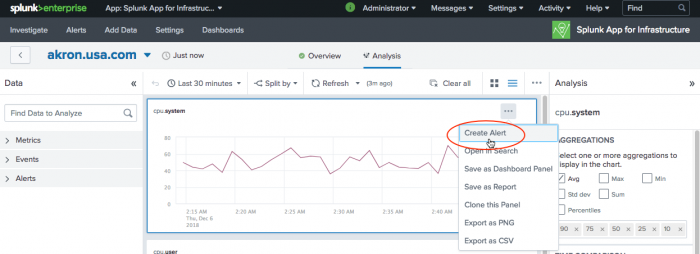
- Select an entity or group you want to investigate and drill down Analysis Workspace.
- Select a metric chart for which you want to create an alert.
- (Optional). If you have selected to create an alert for a group, click Select All By for the metric you want to split (for example, host).
- (Optional) Drag your cursor over a time area and data in the chart to pinpoint what data to use to create the alert.
- In the top-right corner of the chart, click the
 icon.
icon.
- Click Create Alert.
- Note: If you do not see the Create Alert link, you might not be logged in as a user with permissions to create alerts. The metrics panel also needs to contain data in order to create an alert and access the Create Alert link.
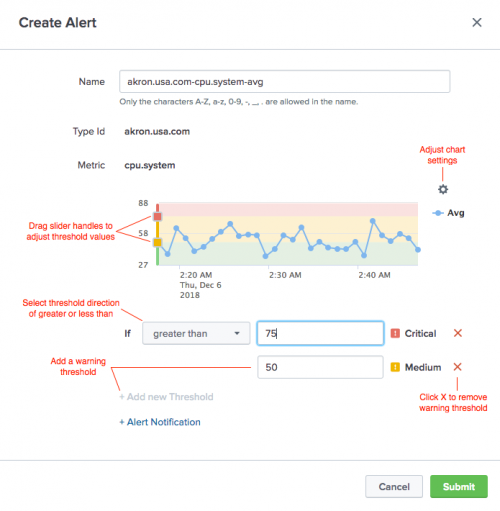
- In the Create Alert dialog set alert thresholds. The alert chart in the dialog visually displays the thresholds.
- A name for the alert is automatically generated for the alert, or you can enter a custom name for the alert following the character requirements.
- The Type Id and Metric are pre-populated, indicating the entity name and metric used.
- The details of the selected chart used to create the alert are displayed.
- Set up trigger conditions, which are threshold settings.
- The Critical threshold is required. You can adjust this threshold value, but the threshold cannot be deleted.
- Add a new threshold, also considered a Warning threshold. You can adjust this threshold value, and delete this threshold.
- Drag the slider handles to adjust the threshold values.
- Adjust chart settings.
- Available severity levels include Info, Medium, and Critical.
- Configure Alert Notification options for when the alert triggers. See Configure Alert Notification Settings in Splunk App for Infrastructure.
- Click Submit. The alert is added to the Alerts dropdown in the Data section of the Analysis Workspace and displays on the Alert page if triggered.
Edit an alert
Edit an alert to change threshold trigger conditions, or to add or change email recipients for notification for when the alert triggers.
| Configure alert notifications in Splunk App for Infrastructure | Manage Admin and User Accounts in Splunk App for Infrastructure |
This documentation applies to the following versions of Splunk® App for Infrastructure (EOL): 1.2.2, 1.2.3


 Download manual
Feedback submitted, thanks!