Network monitoring
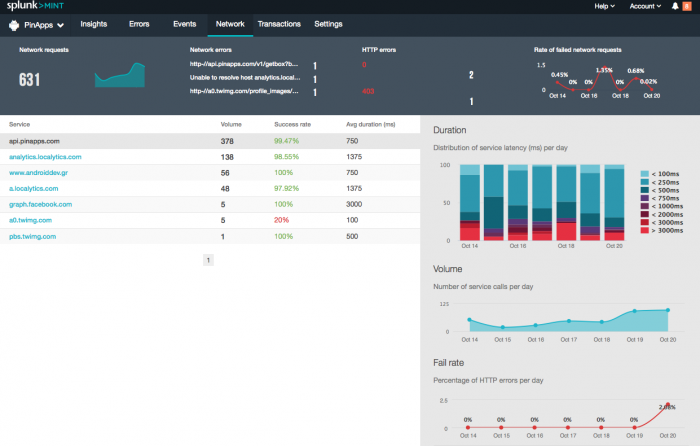
The Network dashboard measures the volume, latency, and status of all HTTP connections, helping you to understand the network’s contribution to transaction response times or query response times from web servers.
The Network dashboard shows a summary of network activity over the last seven days. You can quickly see how many network requests there were, the most frequent exception, HTTP status codes and the trend of failed requests.
Success rates are based on the status code that comes from the server as response data:
- A successful network request has a status code between 200-399.
- A failed network request has a status code between 0-199 or 400-599.
The table on this page shows the network requests that have been made to services over the last seven days. Click a service to see details about it:
- The breakdown of request latency per day, where each bar section corresponds to a bucketed time duration in milliseconds, letting you quickly see the distribution of network latency each day.
- The volume of requests.
- The rate of failed requests.
Modify network monitoring in your mobile apps
Network monitoring is implemented by default, but to modify the way network monitoring works, see the following topics in the Splunk MINT SDK Developer Guides:
| Event monitoring | Transaction monitoring |
This documentation applies to the following versions of Splunk MINT™ Management Console (EOL): 1.0

 Download manual
Feedback submitted, thanks!