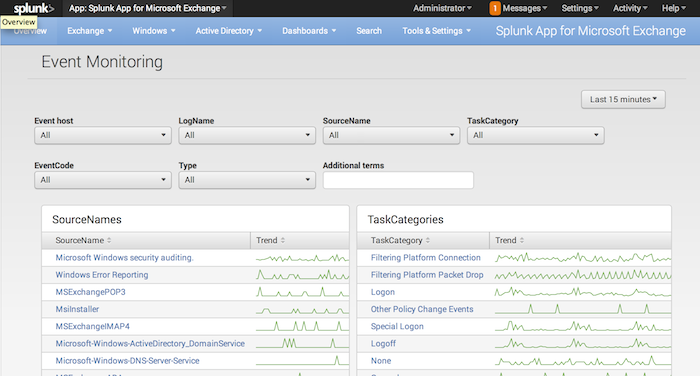
Event Monitoring
The Event monitoring page contains dashboard panels for many Windows Event Log statistics. They include trend lines which help you isolate areas of peak activity. You can mouse over the trend lines to get individual values, and click the trend lines to open a Search window that shows events collected in the time frame where you clicked.
The panels are:
- Event source names
- Task categories
- Hosts
- Event IDs
- The number of events by host over time
- The number of events by event code over time
- The number of events by log name over time
- The number of events by event type over time
Filter event log data
At the top of the Event Monitoring page, there is a row of drop-down boxes that lets you filter the indexed data via a number of parameters:
- Host
- Event Log Name
- Source Name
- Task Category
- Event Code
- Type
The parameters filter out data based on what you pick in each drop down. For example, if you select a host in the Host drop down, the other drop-downs update to show only data collected for that host. In this way, you can "drill down" to find the event log data for the host, log channel, source name, task category, event code, and type you seek.
Additionally, each drop down box is also a text field. You can click your mouse on any drop down box on the page to enter text into that box. The Splunk App for Windows immediately filters the collected data to show only entries that match what you type into any of the boxes.
Finally, the Additional Search Criteria text entry box allows you to search for a specific word or phrase across all of your indexed event log data.
Requirements
The dashboards on this page require you to enable one or more Windows event log inputs (Splunk recommends that you enable at least the Application, System, Security, and Setup log channels).
Use the wild-card capability on the 'Host' drop down control
This page has a Host drop-down control box. You can type in text, including wildcards, and the Splunk App for Microsoft Exchange filters the data to include only those events generated by hosts whose names match the text that you enter.
This works particularly well if you use a standard host naming convention in your environment. For example, if all domain controllers in the environment have host names which contain the strong "DC", or all IIS servers' host names contain the string "IIS", you can type in "DC" in any Host control to display data collected from all domain controllers, or "IIS" to display information from all computers in your environment that run Internet Information Server.
| Windows Overview | Performance Monitoring |
This documentation applies to the following versions of Splunk® App for Microsoft Exchange (EOL): 3.0.1, 3.0.2, 3.0.3

 Download manual
Feedback submitted, thanks!