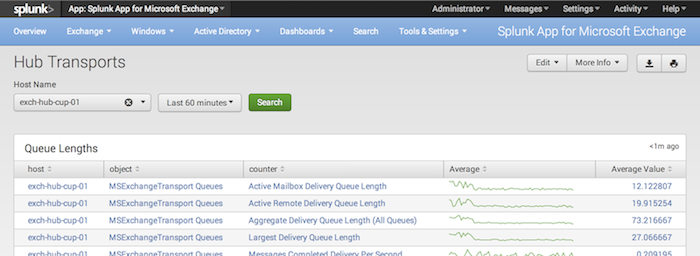
Hub Transports
This page displays information about the performance of your Exchange Hub Transport servers. The dashboard breaks down into several panels:
- Queue Lengths show you the current average of your Hub Transport Servers' queue lengths.
- Core Counters show you the standard performance counters (%CPU used, available memory, and network usage) for your Hub Transport Server systems.
- Hub Transport Counters show you Hub Transport-specific counters.
If you don't see any data in this dashboard, make sure you have enabled the Performance Monitoring data set on each Hub Transport server.
Note: Microsoft recommends a maximum queue length of 250 for "active" queues and 100 for all other queues. The poison queue should be zero at all times. For more information about monitoring Hub Transport servers, check out "Monitoring Hub Transport servers" (http://technet.microsoft.com/en-us/library/bb201704(EXCHG.80).aspx) on Microsoft TechNet.
How to use this page
- In the Host Name drop down, select the server you want to get information on.
- Optionally, use the time picker to select the range of time that you want the panels to display.
- For each panel, you can sort the contents by clicking on the column header button. Clicking more than once on the same column header toggles between ascending and descending sort based on that column.
- You can mouse over the spark line in the "Average" column to see individual data points for the chosen metric.
- You can click on any point in the spark line to load the "Performance" page for the selected server, performance object, and performance counter.
| Client Access Servers | Mailbox Stores |
This documentation applies to the following versions of Splunk® App for Microsoft Exchange (EOL): 3.0, 3.0.1, 3.0.2, 3.0.3

 Download manual
Feedback submitted, thanks!