Analyze a Mailbox Database
This page gives you information about a specific database in your Exchange deployment.
It has several panels:
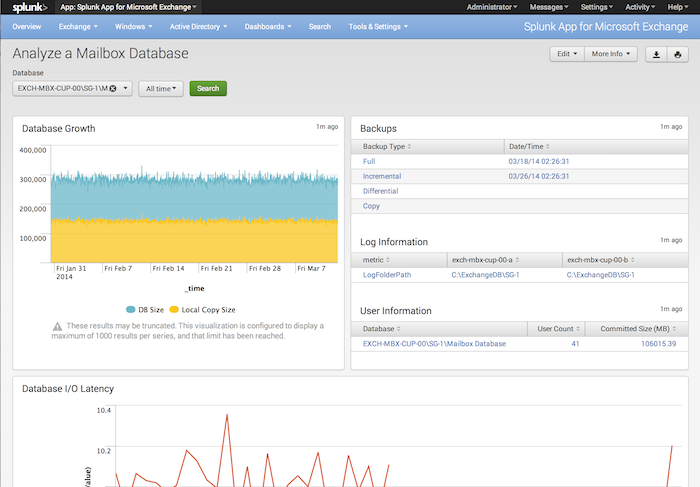
- The Database Growth panel is an area chart that shows the growth of the Exchange database over a period of time that you set in the time range picker. It shows information on both the overall database's size and the size of the local copy of the database on the server.
- The Backups panel shows when you last backed up the database. It lists information for full, incremental, differential, and copy backups.
- The Log information panel displays where you have configured your database log folder to be.
- The User information panel displays the number of users in this database and how much space the database takes up (committed size), in megabytes.
- The Database I/O latency panel is a line chart that displays the average database latency, in seconds, over the period of time you set in the time range picker.
How to use this page
- In the Database drop down, select the database you want to get information on. The Splunk App for Microsoft Exchange reloads the page to display information about the database.
- Optionally, use the time picker to select the range of time that you want the panels to display.
- For the Backups, Log Information, and User Information panels, you can sort the contents by clicking on the column header button. Clicking more than once on the same column header toggles between ascending and descending sort based on that column.
- For the Database Growth and Database I/O latency panels, you can mouse over each line to see individual data points for the chosen metric.
- You can click on any point in the lines for these panels to load the base search that produced the results shown in the panel.
| Mailbox Database Overview | Clustering and Replication |
This documentation applies to the following versions of Splunk® App for Microsoft Exchange (EOL): 3.1.0, 3.1.1, 3.1.2, 3.1.3, 3.2.0, 3.2.1, 3.3.0

 Download manual
Feedback submitted, thanks!