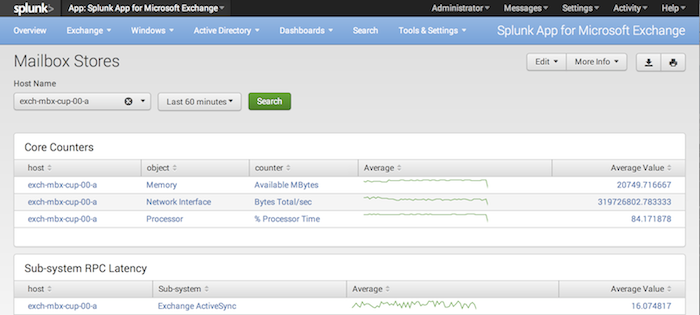
Mailbox Stores
This page displays information about the performance the Mailbox Store hosts in your Microsoft Exchange environment.
The page breaks down into several panels:
- The Core Counters panel shows you the standard performance counters (percent CPU used, available memory, and network usage) for your Mailbox Store systems.
- The Sub-system RPC latency panel shows you the different remote procedure call (RPC) latencies for various Exchange subsystems (such as ActiveSync, Content Indexing, and more), per host.
- The Sub-system RPC operations/sec panel shows you how many of these subsystem operations occur per second on a host.
- The Store Counters panel provides specific performance monitoring information for Mailbox Store services.
- The Calendar counters panel provides information on calendar-based performance monitoring ("MSExchange Resource Booking" and "MSExchange Calendar Attendant") objects.
How to use this page
- In the Host Name drop down, select the Mailbox Store host you want to get information on.
- Optionally, use the time picker to select the range of time that you want the panels to display.
- For each panel, you can sort the contents by clicking on the column header button. Clicking more than once on the same column header toggles between ascending and descending sort based on that column.
- You can mouse over the spark line in the "Average" column to see individual data points for the chosen metric.
- You can click on any point in the spark line to load the "Performance" page for the selected host, performance object, and performance counter.
| Hub Transports | Managed Folder Assistants |
This documentation applies to the following versions of Splunk® App for Microsoft Exchange (EOL): 3.4.2, 3.4.3, 3.4.4, 3.5.0, 3.5.1, 3.5.2, 4.0.0, 4.0.1, 4.0.2, 4.0.3

 Download manual
Feedback submitted, thanks!