Parallel coordinates components
Learn how to interpret a parallel coordinates visualization.
Visual elements
Axes
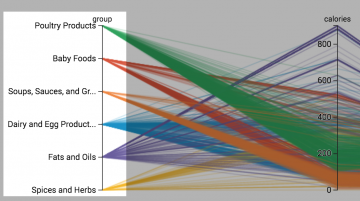
Each vertical axis in the visualization represents a data dimension or field. The Y-axis shows values in the dimension where a pattern originates. A visualization can include one or more additional dimensions that are part of this pattern.
Coordinates
Each axis has coordinates to represent values in a data dimension or field.
This screenshot zooms in on two coordinates on a particular axis.

Lines
Lines in the visualization connect coordinates. Each line corresponds to a row in the Statistics results table. Lines show patterns in the data by illustrating relationships between different data dimensions.
| Create a parallel coordinates query | Customize parallel coordinates |
This documentation applies to the following versions of Parallel Coordinates (EOL): 1.0.0, 1.1.0, 1.2.0, 1.3.0, 1.4.0, 1.5.0

 Download manual
Feedback submitted, thanks!