Tutorial: Use the app wizard to develop an app framework
This section covers app development on the Phantom Enterprise Platform. It discusses steps that need to be taken in order to successfully develop an app that interacts with an external device or service, and implements actions that can be run through the Phantom platform.
This tutorial uses the App Wizard to design and develop an App Framework. Code is then added to framework to connect to an external service and return the results back to the Phantom platform.
Getting Phantom Enterprise OVA
It is best to use a running Phantom instance for developing a Phantom App. You can download the OVA by going to https://www.phantom.us/download/ and registering for an account on the Phantom portal. Once the account request process is complete and you have created your own login, you can download the OVA from the Phantom community portal at https://my.phantom.us/.
App Overview
As mentioned in other sections of the App Developers Guide, an App made for the Phantom Enterprise product has two basic interfaces:
- An interface to interact with an external device or service, such as whois or VirusTotal, to implement an action.
- An interface to interact with the Phantom platform to run actions, send progress messages, and return action results.
The App Framework created by the App Wizard will contain sample code that does both.
Setting up the dev environment
Once the OVA file is downloaded, boot it up in VMware (or your virtual machine software of choice) and set the root and user passwords. See the Phantom Quickstart Guide under Documentation for installation instructions. Remote root login is disabled, so you will have to ssh in as user and sudo to root.
The firewall is pre-configured to allow ssh connections.
SSH to Phantom
mymbp:~ alice$ ssh user@172.16.242.150
user@172.16.242.150's password:
[user@localhost ~]$ sudo su -
[sudo] password for user:
[root@localhost ~]#
Set the hostname
Optionally set the hostname of the instance:
[root@localhost ~]# hostname appdev
[root@localhost ~]#
User 'phantom'
Good practice suggests the use of a non-root user for app development. The user phantom is already present in the OVA and can be used for this purpose. However, this user does not have a password set and therefore cannot ssh into the phantom instance.
Set the password for the user phantom:
[root@localhost ~]# passwd phantom
Changing password for user phantom.
New password:
Retype new password:
passwd: all authentication tokens updated successfully.
[root@localhost ~]#
Exit and login as phantom.
[root@localhost ~]# exit
logout
[user@localhost ~]$ exit
logout
Connection to 172.16.242.150 closed.
mymbp:~ alice$ ssh phantom@172.16.242.150
phantom@172.16.242.150's password:
[phantom@appdev ~]$
View the ipinfo.io documentation
Use the ipinfo.io API documentation to complete the implementation of the App. The documentation can be found at https://ipinfo.io/developers.
When reading the API documentation, determine what requests to make for implementing your app actions. You want to find a request for resolving a hostname and a request for getting geolocation information for an IP. Also look for a request that will help you implement your test connectivity action, which verifies that your asset configuration is correct.
Looking through ipinfo.io's documentation, these are probably the requests you want to send for each action:
- geolocate ip: http://ipinfo.io/<IP_ADDRESS>/geo
- lookup ip: http://ipinfo.io/<IP_ADDRESS>/hostname
- test connectivity: http://ipinfo.io/region
Test connectivity can be any endpoint. If possible, it's best to try to use a /version or /ping endpoint if those exists, but if they don't (like in this case) any small request will suffice.
Using cURL to test the API
As one final sanity check before adding any code, check to see if these requests will all work as expected. cURL is a great tool to use for doing a simple check like this.
[phantom@appdev ~]$ curl "http://ipinfo.io/8.8.8.8/geo"
{
  "ip": "8.8.8.8",
  "city": "Mountain View",
  "region": "California",
  "country": "US",
  "loc": "37.3860,-122.0840",
  "postal": "94035",
  "phone": "650"
}
[phantom@appdev ~]$ curl "http://ipinfo.io/8.8.8.8/hostname"
google-public-dns-a.google.com

[phantom@appdev ~]$ curl "http://ipinfo.io/region"
California

[phantom@appdev ~]$
Fortunately, every request returns the necessary information to implement the App's actions within the Splunk Phantom Platform.
App Wizard
For this scenario, use the App Wizard to create an App that integrates with the ipinfo.io service by implementing the geolocate ip action.
- Navigate to the Main Menu.
- Select Apps.
- Click APP WIZARD.
The App Wizard is broken up in multiple tabs, each representing a logical part of an App. Most of the input elements within the App Wizard have an info icon next to them. On mouse hover, these icons reveal detailed help tips, including (but not limited to) naming conventions.
Basic Details
For our tutorial app, fill the following values on this tab
| Field | Value |
|---|---|
| App Name | ipinfo io |
| App Description | This app implements investigative actions on ipinfo.io geolocation service |
| Product Vendor | ipinfo.io |
| Product Name | ipinfo.io |
| App Publisher | Tutorial |
You can keep the Distribute with source unchecked.
This tutorial assumes the Python 3 checkbox is also unchecked.
Click on the logo drop boxes to upload a logo. Ideally, the logos are SVG files, but PNG files are also supported.
Asset Configuration
To get geolocation info about an ip from ipinfo.io, connect to https://ipinfo.io/<ip_to_query>. The base URL of https://ipinfo.io can be hardcoded in the App, but for this scenario, add a configuration option.
- Click the Add Configuration Option button.
This results in a single row where you can set your configuration options. - Fill in the following values:
Field Value Name base_url Data Type String Description The Base URL to connect to Required Checked - Click More, set the Default value to https://ipinfo.io, and click Update.
This allows the Splunk Phantom platform to display a default value for users when they configure a new asset.
This comes in handy, for example, when there are generally unchanging values for certain parameters like an ssh port number. In this case, if the ipinfo.io were to change domains but offer the exact same service, you do not need to change any app code.
App Actions
A list of recommended actions that the App implements is based on the category you choose. For this tutorial, select the following:
- Select the App Category of information.
- Select the Available Action geolocate ip and move it to the Selected Actions.
- Fill in the following values for the test connectivity actions:
Field Value REST Endpoint "/region" - Fill in the following value for the geolocate ip action
Field Value REST Endpoint "/{0}/geo".format(ip)
Custom Actions
If you want to add any actions other than the recommended actions, you can configure them here. For this tutorial scenario, add a custom action called lookup ip.
- Click ADD ACTION and fill in the following values:
Field Value Action Name lookup ip Description Returns the resolved hostname Action Type Investigate Read Only Checked REST Endpoint "/{0}/hostname".format(ip) Verbose Description Use this action to return only the hostname from ipinfo.io - Click ADD PARAMETER and fill in the following values:
Field Value Name ip Data type String Description IP to get the hostname of Required Checked Primary Checked - Click the Contains check box and type ip in the drop-down box.
- Click UPDATE.
- Click SUBMIT to save the app tarball on your local machine.
Compiling and installing the app
Copy the app tarball to the OVA as user phantom. Replace ipinfoio.tgz with the name of your file.
Copy the App tarball to the OVA
AMBP2:appdev_tutorial alice$ scp ./ipinfoio.tgz phantom@172.16.242.177:~/
phantom@172.16.242.177's password:
ipinfoio.tgz                                                                             100% 7720     3.6MB/s   00:00
AMBP2:appdev_tutorial alice$
Untar the app source tarball
Untar the app source tarball to compile and install the app.
AMBP2:appdev_tutorial alice$ ssh phantom@172.16.242.177
phantom@172.16.242.177's password:
[phantom@phantom ~]$ ls
ipinfoio.tgz
[phantom@phantom ~]$ tar -zxvf ipinfoio.tgz
phipinfoio/
phipinfoio/readme.html
phipinfoio/ipinfoio_consts.py
phipinfoio/ipinfoio.png
phipinfoio/ipinfoio_connector.py
phipinfoio/__init__.py
phipinfoio/exclude_files.txt
phipinfoio/ipinfoio.json
Compile and install the app
Note that you will not be able to install the app from the tarball that downloaded directly from the App Wizard, as it will need to be compiled before you can do so.
There are two scripts for compiling. One script is for use with Python2.7 and the other is for use with Python3. Both scripts are used to compile the app source files into pyc files, validate the App JSON, create the tarball and use the platform to install the app tarball on the platform.
Command for compiling with Python 2.7
Compile with Python 2.7. Notice the usage of the compile_app.pyc script.
[phantom@phantom ~]$ cd phipinfoio
[phantom@phantom phipinfoio]$ phenv python2.7 /opt/phantom/bin/compile_app.pyc -i
Command for compiling with Python 3
Compile with Python3. Notice the usage of the phenv python3 and the /py3 path to the compile script.
[phantom@phantom ~]$ cd phipinfoio
[phantom@phantom phipinfoio]$ phenv python3 /opt/phantom/bin/py3/compile_app.pyc -i
If you want to compile in Python 3, the compile_app.pyc script expects the python_version key in the app JSON to be set to 3.
Compilation and installation messages
On compilation, the script creates the ../phipinfo.tgz tarball. This is an app installable tarball that also can be installed from the UI. However during app development, it's faster to install from the command line using the compile_app<x> script.
cd'ing into ./
Compiling: ./ipinfoio_connector.py
Compiling: ./ipinfoio_consts.py
Compiling: ./__init__.py
Validating App Json
  Working on: ./ipinfoio.json
    Looks like an app json
  Processing App Json
  Processing actions
    test connectivity
      No further processing coded for this action
    geolocate ip
      Following required data paths not in output list
        action_result.data
        action_result.summary
    lookup ip
      Following required data paths not in output list
        action_result.data
        action_result.summary
Installing app...
  Creating tarball...
  ../phipinfoio.tgz
  Calling installer...
[phantom@phantom phipinfoio]$
Explore the Installed App
Now that the app has been installed, you can explore the App on the platform.
App Table
- Go to the Main menu.
- Select Apps and search for ipinfo.
It appears in the Unconfigured Apps tab. - Expand the supported actions node to reveal the action names and their descriptions:
- lookup ip - returns the resolved hostname
- geolocate ip - queries service for IP location info
- test connectivity - validates the asset configuration for connectivity using supplied configuration
On the Splunk Phantom platform, every app requires an Asset configuration to be able to run actions on it.
- Create an Asset by clicking the CONFIGURE NEW ASSET button.
- Fill in the following values on the Asset Info tab:
Field Value Asset Name ipinfo Asset Description ipinfo service - Click the Asset Settings tab. The Base URL field is auto-filled with https://ipinfo.io.
- Click SAVE.
On the same tab, you will see the TEST CONNECTIVITY button. - Click TEST CONNECTIVITY.
This results in the test connectivity app action getting run.
The action will fail with an error to the tune of Action not yet implemented. This is expected, since the default Action handler added by the App Wizard will set the status to Fail with the not yet implemented status string.

Now go back to the App table and click on the Documentation link next to the Version value. This documentation is auto generated by the platform by processing the App JSON. It lists the App details, followed by the contents of the readme.html file, the Asset Configuration Variables, the Action listing and lastly the action details. Note the text that was added to the Action Description and Verbose fields
Running the App Actions
You have now defined a working framework of the App and its Actions. It is installed on the platform and the user can run the actions from the Investigation page and write playbooks.
Run both of these actions from the Investigation page and show that they both fail with the error Action not yet implemented.
For example, do the following to run the geolocate ip action on an event:
- Navigate to the Main menu.
- From the Sources drop-down menu, select My Events.
- Click an event. Take note of the event ID, as you will use this when running the playbook.
- Select Analyst view.
- Click Action.
- Click geolocate ip.
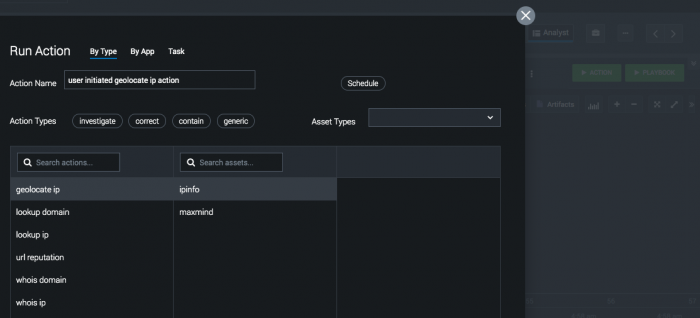
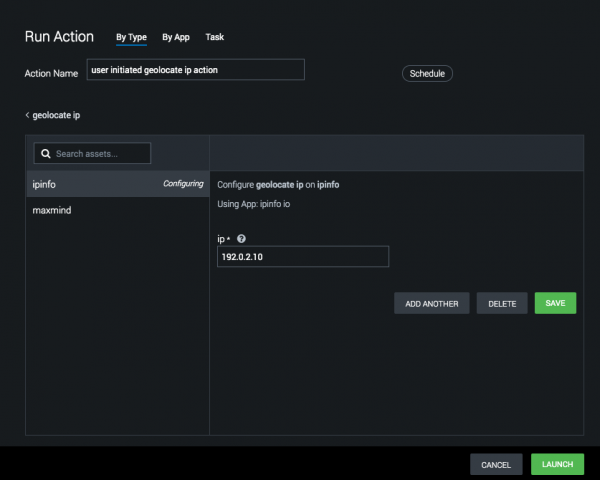
- Click ipinfo.
- Enter the IP address to locate.
- Click Save.
- Click Launch.


The failure message displays under recent activity.

Creating Playbook
Create a playbook for the two actions. The playbook runs both of these actions, and hardcodes in the IP address.
- Navigate to the Main menu.
- Click Playbooks.
- Click +PLAYBOOK.
- From the Start block, drag and release the green node to get started.
You see the types of blocks that you can add. - Click Action and select ipinfo io from Available Apps.
- Click geolocate ip from Available Actions.
- Click ipinfo to configure specific assets.
- From the Start block, drag and release the green node.
- Click Action and select ipinfo io from Available Apps.
- Click lookup ip from Available Actions.
- Click ipinfo to configure specific assets.
- From the Investigate blocks, drag and release the green node to End.
- Click Save.

Running the Playbook
This step assumes that you are still in the same area as Creating a Playbook. To run this playbook,
- Click on Playbook Debugger.
- For the ID field, use the same event ID from when you ran these actions. See Running the app actions.
- Click Test.

This playbook will fail when you run it, since you still need to implement the actions. However, save this for now and come back to it later, since it's a handy tool for quickly checking that all of our app actions are properly implemented.
Adding code to the app
Now you can start editing code in /home/phantom/phipinfoio/ipinfoio_connector.py.
_handle_test_connectivity()
Begin by updating the test connectivity handler to include the following:
- revise self.save_progress
- revise ret_val, response
- uncomment return action_result.get_status()
- uncomment self.save_progress("Test Connectivity Passed")
- uncomment return action_result.set_status(phantom.APP_SUCCESS)
The updates look as follows:
def _handle_test_connectivity(self, param):

    # Add an action result object to self (BaseConnector)
    # to represent the action for this param
    action_result = self.add_action_result(ActionResult(dict(param)))

    self.save_progress("Testing by sending request to /region")

    ret_val, response = self._make_rest_call('/region', action_result)

    if (phantom.is_fail(ret_val)):
        # the call to the 3rd party device or service failed, action result
        # should contain all the error details
        # so just return from here
        self.save_progress("Test Connectivity Failed")
        return action_result.get_status()

    # Return success
    self.save_progress("Test Connectivity Passed")
    return action_result.set_status(phantom.APP_SUCCESS)
Most of this code was already present in the template file. The _make_rest_call(...) provides a wrapper around the Python requests module, and it parses the output and catch any errors from the request as well.
However, there are still some changes to make before test connectivity will successfully pass.
_make_rest_call()
The _make_rest_call(...) has a fair number of optional parameters that you can use.
def _make_rest_call(self, endpoint, action_result, method="get", **kwargs):
    # **kwargs can be any additional parameters that requests.request accepts

    config = self.get_config()

    resp_json = None

    try:
        request_func = getattr(requests, method)
    except AttributeError:
        return RetVal(action_result.set_status(phantom.APP_ERROR, "Invalid method: {0}".format(method)), resp_json)

    # Create a URL to connect to
    url = self._base_url + endpoint

    try:
        r = request_func(
                        url,
                        # auth=(username, password),  # basic authentication
                        verify=config.get('verify_server_cert', False),
                        **kwargs)
    except Exception as e:
        return RetVal(action_result.set_status( phantom.APP_ERROR, "Error Connecting to server. Details: {0}".format(str(e))), resp_json)

    return self._process_response(r, action_result)
The method can be any HTTP method, including "get", "post", "patch", and "delete". Optionally, data expects a dictionary, which is used when POSTing data. Optionally, params expects a dictionary that will be converted into a query string. The headers is also a dictionary of headers to be sent.
Also note that a few lines above the request_func() call there is the line: url = self._base_url + endpoint. This is how you can pass "/region" to _make_rest_call(...), and not the entire URL.
initialize()
You will set _base_url in the initialize() function. The initialize() function is called on every action run before any handlers automatically. Since your app configuration already has a base_url parameter, you need to retrieve that and set it. Here is what initialize() will look like after your changes, and with the unneeded code cleaned out.
def initialize(self):
    # Load the state in initialize, use it to store data
    # that needs to be accessed across actions
    self._state = self.load_state()

    # get the asset config
    config = self.get_config()

    # Access values in asset config by the name

    # Required values can be accessed directly
    self._base_url = config['base_url']

    return phantom.APP_SUCCESS
Remember how both /region and /hostname return the the data as a single line of text (more specifically, the Content-Type header is set to 'text/html'), as opposed to a JSON object. This is unusual for APIs, and the default implementation of _make_rest_call(...) will return an error. The reason for this is that in a majority of the cases an html response is indicative of either making a request to an invalid endpoint, or if there is some kind of error between Splunk Phantom and a connected proxy.
_process_html_response()
You can see this in the _process_html_response(...) function where, regardless of the content of the response, it sets the action_result to phantom.APP_ERROR. You can modify this method to work in your case by adding two new lines of code to return early with an APP_SUCCESS any time you receive a 200 response from ipinfo.io, which indicates a valid response from the server.
def _process_html_response(self, response, action_result):

    # An html response, treat it like an error
    status_code = response.status_code

    # Handle valid responses from ipinfo.io
    if (status_code == 200):
        return RetVal(phantom.APP_SUCCESS, response.text)

    try:
        soup = BeautifulSoup(response.text, "html.parser")
        error_text = soup.text
        split_lines = error_text.split('\n')
        split_lines = [x.strip() for x in split_lines if x.strip()]
        error_text = '\n'.join(split_lines)
    except:
        error_text = "Cannot parse error details"

    message = "Status Code: {0}. Data from server:\n{1}\n".format(status_code,
            error_text)


    message = message.replace('{', '{{').replace('}', '}}')


    return RetVal(action_result.set_status(phantom.APP_ERROR, message), None)
Also, you know that a valid response of this type will consist of only a single line of text without any HTML tags or anything, so you don't need to worry about using a module like BeautifulSoup to parse it, so just using 'response.text' is sufficient.
The RetVal class is a way of returning a tuple. Using a class like this makes it easier for errors to be caught when going through a linter.
And with these changes, you can now recompile and run test connectivity, which will successfully pass.
- Assuming that you are still in the Asset Settings tab of your existing ipinfo asset. See App Table.
- Click TEST CONNECTIVITY.

Now you need to edit code in both of your action handlers. The changes you made to get test connectivity to pass will help these actions, so you won't need to do as much work this time.
_handle_geolocate_ip()
Let's step through the handler for geolocate ip. For this action, you want to use the endpoint "<IP_ADDRESS>/geo". The IP address you want to check is a required parameter, so you can get it in a similar manner to the base_url. With the IP address, you will construct the endpoint URI, then pass that to _make_rest_call(...):
# Required values can be accessed directly
ip = param['ip']

# make rest call
ret_val, response = self._make_rest_call("/{0}/geo".format(ip), action_result)
One of the most important aspects of actions is their ability to save data for later use. You can add data to the action_result object that will end up being sent to Splunk Phantom after the action is done executing.
# Add the response into the data section
action_result.add_data(response)
It is also possible to add a dictionary object as a summary to show important information about the action once it's done executing. This allows the App author to add the most important part of the result in the summary for consumption of the user in the playbook and also get it displayed in the UI at a prominent position. You make use of update_summary({}) to get the current summary back and append new values to it. In this case, you add the key coordinates and set it to the latitude and longitude returned from ipinfo.io in the loc field.
# Add a dictionary that is made up of the most important values from data into the summary
summary = action_result.update_summary({})
summary['coordinates'] = response["loc"]
Here is what your method looks like with everything added:
def _handle_geolocate_ip(self, param):

    # Implement the handler here
    # use self.save_progress(...) to send progress messages back to the platform
    self.save_progress("In action handler for: {0}".format(self.get_action_identifier()))

    # Add an action result object to self (BaseConnector) to represent the action for this param
    action_result = self.add_action_result(ActionResult(dict(param)))

    # Access action parameters passed in the 'param' dictionary
    # Required values can be accessed directly
    ip = param['ip']

    # make rest call
    ret_val, response = self._make_rest_call("/{0}/geo".format(ip), action_result)

    if (phantom.is_fail(ret_val)):
        # the call to the 3rd party device or service failed, action result should contain all the error details
        # so just return from here
        return action_result.get_status()

    # Now post process the data,  uncomment code as you deem fit

    # Add the response into the data section
    action_result.add_data(response)

    # Add a dictionary that is made up of the most important values from data into the summary
    summary = action_result.update_summary({})
    summary['coordinates'] = response["loc"]

    # Return success, no need to set the message, only the status
    # BaseConnector will create a textual message based off of the summary dictionary
    return action_result.set_status(phantom.APP_SUCCESS)
_handle_lookup_ip
You can do the same thing for the lookup ip handler, noting that you want to send a request to /hostname as opposed to /geo. The action result only accepts a dictionary or JSON object. With our changes to _process_html_response(...), the data you get back is raw text. You need to construct a dictionary and add it to the action result.
# Add the response into the data section
response_dict = {'host_name': response}
action_result.add_data(response_dict)
And since the response is so simple, also update the summary with that same key/value pair.
# Add a dictionary that is made up of the most important values from data into the summary
summary = action_result.update_summary({})
summary['host_name'] = response
With all that added, your handle for lookup ip is similar to this:
def _handle_lookup_ip(self, param):

    # Implement the handler here
    # use self.save_progress(...) to send progress messages back to the platform
    self.save_progress("In action handler for: {0}".format(self.get_action_identifier()))

    # Add an action result object to self (BaseConnector) to represent the action for this param
    action_result = self.add_action_result(ActionResult(dict(param)))

    # Required values can be accessed directly
    ip = param['ip']

    # make rest call
    ret_val, response = self._make_rest_call("/{0}/hostname".format(ip), action_result)

    if (phantom.is_fail(ret_val)):
        # the call to the 3rd party device or service failed, action result should contain all the error details
        # so just return from here
        return action_result.get_status()

    # Now post process the data,  uncomment code as you deem fit

    # Add the response into the data section
    response_dict = {'host_name': response}
    action_result.add_data(response_dict)

    # Add a dictionary that is made up of the most important values from data into the summary
    summary = action_result.update_summary({})
    summary['host_name'] = response

    # Return success, no need to set the message, only the status
    # BaseConnector will create a textual message based off of the summary dictionary
    return action_result.set_status(phantom.APP_SUCCESS)
You need to recompile the app before running the playbook again.
Python 2:
[phantom@phantom phipinfoio]$ phenv python2.7 /opt/phantom/bin/compile_app.pyc -i
or
Python 3:
[phantom@phantom phipinfoio]$ phenv python3 /opt/phantom/bin/py3/compile_app.pyc -i
Running the Playbook Again
Since you've implemented the actions and recompiled the app, you can run your playbook again. This time, both of the actions pass.
- Click on Playbook Debugger.
- For the ID field, use the same event ID from when you ran these actions. See Running the app actions.
- Click Test.

Recent Activity also shows success

create_output.pyc
Now that you've successfully run both of the actions, you can use the create_output.pyc script to automatically populate the output list with values. First, find out the app run ID for one of the actions. As an example, use the geolocate ip action to illustrate this.
- In Recent Activity, click on a success message.
- The APP RUN ID shows in the first column of the display.

With the app run ID, you have all the information you need to update the output.
Command for updating output with Python 2.7
Notice the usage of the phenv python2.7 and the /bin path to the script.
[phantom@appdev phipinfoio]$ phenv python2.7 /opt/phantom/bin/create_output.pyc --username admin --password password --app_run_id 1 --app_json ipinfoio.json
Created backup: ipinfoio.json.bak
Updating action: geolocate ip
Successfully updated action output
[phantom@appdev phipinfoio]$
Command for updating output with Python 3
Notice the usage of the phenv python3 and the /py3 path to the script.
[phantom@phantom phipinfoio]$ phenv python3 /opt/phantom/bin/py3/create_output.pyc --username admin --password password --app_run_id 1 --app_json ipinfoio.json
Creating a Table Widget
Unlike previous versions of Phantom, you don't need to copy anything into the app JSON manually. However, that doesn't mean you are done yet. On the Investigate page, the Table widget for the app is still empty. In order to populate it with data, you need to choose which data from the output you want to display.
You can add column_name and column_order to your /home/phantom/phipinfoio/ipinfoio.json file and it will be rendered to the Table widget. For reference, here is what your app looks like in the Investigation page without changing the widget.

The App Wizard will include some of the output fields that it knows about into the widget when its created, but in most cases those aren't going to be sufficient. In this case, since it is geolocate IP, you want to add information pertinent to that. In the case of this API, all of the fields are okay in the output. Other APIs will return much more information than this, though, so you need to be selective about those you want to display.
After adding some things to the output in ipinfoio.json, and removing the ones the App Wizard created, this is what we will have left:
...
"output": [
    {
        "data_path": "action_result.data.*.ip",
        "data_type": "string",
        "example_values": [
            "8.8.8.8"
        ],
        "contains": [
            "ip"
        ],
        "column_name": "IP",
        "column_order": 0
    },
    {
        "data_path": "action_result.data.*.country",
        "data_type": "string",
        "example_values": [
            "US"
        ],
        "column_name": "Country",
        "column_order": 1
    },
    {
        "data_path": "action_result.data.*.region",
        "data_type": "string",
        "example_values": [
            "California"
        ],
        "column_name": "Region",
        "column_order": 2
    },
    {
        "data_path": "action_result.data.*.city",
        "data_type": "string",
        "example_values": [
            "Mountain View"
        ],
        "column_name": "City",
        "column_order": 3
    },
    {
        "data_path": "action_result.data.*.loc",
        "data_type": "string",
        "example_values": [
            "37.3860,-122.0840"
        ],
        "column_name": "Location",
        "column_order": 4
    }
    ...
]
Make sure the ipinfoio.json is the only JSON file in the directory. Recompile and reinstall the app. See Compile and install the app.
Now look at the output. After reinstalling the app with your changes to the table widget, you don't need to re-run any actions for the changes to show up. The old actions will have their widgets updated.
If the widget is not displaying, do the following from the Investigation page:
- Click MANAGE WIDGETS.
- Slide the ipinfo io toggle to ON.
- Click SAVE LAYOUT.
- Click CLOSE.

About Contains
As you may have noticed both output and action parameters can have a contains value. By matching contains in the output with parameters, playbooks can easily be configured and run based off the output of a previous action.
You can also use contains in the UI. In your own app, for example, you can see how there is an IP in the output, and both actions take an IP as a primary parameter. Because of this, if you click on actual IP value, you can see a menu pop up with various actions that you can run on an IP, including the two from your own app. By clicking on that, it will take you to an action menu with the relevant parameters already filled out.
The create_output.pyc script can add in common contains fields on its own, like 'ip', as well as different types of hashes, URLs, and email addresses. For your own app, there are many times when it makes sense to add in a contains that only that app will use, like a ticket ID on a ticketing platform, for example. In that case when adding in the contains, you can follow the convention of "<app name> ticket id", so that there is no conflict with contains from other apps that might have a "ticket id".
Creating Custom Views
You can also pass data into your own Django templates, which will be rendered as the output. See Creating Custom Views for information on how to do this.
Debugging
It is also possible to run actions with a debugger. Open up /home/phantom/phipinfoio/ipinfoio_connector.py and look at the bottom of the file, in the main section.
if __name__ == '__main__':

    import sys
    import pudb
    import argparse

    pudb.set_trace()

    argparser = argparse.ArgumentParser()

    argparser.add_argument('input_test_json', help='Input Test JSON file')
    argparser.add_argument('-u', '--username', help='username', required=False)
    argparser.add_argument('-p', '--password', help='password', required=False)

    args = argparser.parse_args()
    session_id = None

    username = args.username
    password = args.password

    if (username is not None and password is None):

        # User specified a username but not a password, so ask
        import getpass
        password = getpass.getpass("Password: ")

    if (username and password):
        try:
            print ("Accessing the Login page")
            r = requests.get("https://127.0.0.1/login", verify=False)
            csrftoken = r.cookies['csrftoken']

            data = dict()
            data['username'] = username
            data['password'] = password
            data['csrfmiddlewaretoken'] = csrftoken

            headers = dict()
            headers['Cookie'] = 'csrftoken=' + csrftoken
            headers['Referer'] = 'https://127.0.0.1/login'

            print ("Logging into Platform to get the session id")
            r2 = requests.post("https://127.0.0.1/login", verify=False, data=data, headers=headers)
            session_id = r2.cookies['sessionid']
        except Exception as e:
            print ("Unable to get session id from the platfrom. Error: " + str(e))
            exit(1)

    if (len(sys.argv) < 2):
        print "No test json specified as input"
        exit(0)

    with open(sys.argv[1]) as f:
        in_json = f.read()
        in_json = json.loads(in_json)
        print(json.dumps(in_json, indent=4))

        connector = TestAppDebugCodeConnector()
        connector.print_progress_message = True

        if (session_id is not None):
            in_json['user_session_token'] = session_id

        ret_val = connector._handle_action(json.dumps(in_json), None)
        print (json.dumps(json.loads(ret_val), indent=4))

    exit(0)
Look at the code in detail:
- The first few lines are imports followed by the line
pudb.set_trace(). This line of code runs a runtime breakpoint and brings up the PuDB debugger. - This code expects as input a JSON file that contains data like the configuration and action parameters, which it tries to load:
in_json = json.loads(in_json) - The input JSON is then dumped on the console
print(json.dumps(in_json, indent=4))for debugging purposes. - Next, the
IpinfoIoConnector()class object is created connector = IpinfoIoConnector() - Some member variables of this object are set, and the
_handle_actionmember function is called with the json as input:ret_val = connector._handle_action(json.dumps(in_json), None) - Finally, the return value of the
_handle_actionis dumped on the console before exiting. - The code also allows passing the username and password as optional command line switches
A few things to note here:
- Running the
ipinfoio_connector.pyscript under a debugger runs the App in standalone mode. I.e. it does not talk with the Phantom platform (for the most part). Any progress messages that the app sends are dumped on the console and not sent to the platform. This type of execution helps in debugging the App code that interacts with the external device, in this case the ipinfo.io servers - The code
connector._handle_action(json.dumps(in_json), None), notice the _ (underscore) prefixed to the_handle_actionfunction. The___handle_action__function is implemented in theBaseConnectorclass, which does a bunch of pre-processing with the input JSON including parameter presence validations. If everything looks good, it then calls theIpinfoIoConnector::handle_actionfunction. - All REST calls to the Splunk Phantom platform require a valid session id. If the action is performing such REST calls to the Splunk Phantom platform, pass the username and password during the debugging session. The code uses these values to generate a session id and places it in the passed test JSON before calling the
_handle_actionfunction. NOTE: The generated code allows setting the password interactively if not specified on the command line
Debug Environment
Before you can run an action to debug a few things need to be setup:
Creating a Test JSON
Make use of the create_tj.pyc script to expedite the process of producing a test JSON file. In order to use this script, enable debug logging:
- Navigate to the Main menu.
- Select Administration.
- From the System Health drop-down menu, select Debugging.
- From the Action Daemon Log Level drop-down menu, select Debug.
- Click Save.
Then create a test JSON based off the most recent run with the specified action name.
Command for creating test json with Python 2.7
Notice the usage of the phenv python2.7 and the /bin path to the script.
[phantom@appdev phipinfoio]$ phenv python2.7 /opt/phantom/bin/create_tj.pyc "geolocate ip"
Matched 2 lines, will pick up the last line
IPC json added to file: '/tmp/ipinfoio-geolocate_ip.json'
[phantom@appdev phipinfoio]$
Command for creating test json with Python 3
Notice the usage of the phenv python3 and the /py3 path to the script.
[phantom@appdev phipinfoio]$ phenv python3 /opt/phantom/bin/py3/create_tj.pyc "geolocate ip"
The generated test JSON is going to have more fields than the ones specified above, but for the sake of testing those can be safely ignored.
Test JSONs
In the usual scenario, when an action is run by the user through the Phantom platform, the platform gathers the asset and action information and other values and creates a JSON that is fed to the BaseConnector::_handle_action function. This performs various validations and pre-processing on this input JSON before handing it down to the AppConnector's (such as IpinfoIoConnector) member functions. Please see the Connector Module section from more info.
What the test JSONs do is fake this input JSON as if it came from the Phantom platform and the code in the main handler calls the BaseConnector::_handle_function directly.
These test JSONs files need to contain the mandatory keys, in addition to the asset config and action parameter values.
In the case of the "geolocate ip" action, this JSON looks as follows:
[phantom@appdev phipinfoio]$ cat /tmp/ipinfoio-geolocate_ip.json
{
    "asset_id": "4",
    "connector_run_id": 2,
    "parameters": [
        {
            "ip": "8.8.8.8",
        }
    ],
    "debug_level": 3,
    "action": "geolocate ip",
    "identifier": "geolocate_ip",
    "config": {
        "base_url": "https://ipinfo.io"
    }
}
[phantom@appdev phipinfoio]$
- app_config
- This key describes the configuration specific to the app (not the asset). Since the IpinfoIo app does not have any app-specific configuration this key is set to null.
- asset_id
- This key is supposed to contain the id of the asset that the action is run on. Its value does not matter for debugging purposes. But to get the correct value, in the web UI go to Apps and select the configured asset for ipinfo io. The URL in the browser is of the format https://phantom_ip_address/apps/app_id/asset/asset_id. Copy the numeric id that is the last part of the URL and paste it as the value of the
asset_idkey.
- config
- This is the asset configuration. In this example file the "base_url" is set to "https://ipinfo.io".
- debug_level
- If nonzero, then the debug_prints will be logged on the console. They will also be logged in the
/var/log/phantom/spawn.logfile when the actions are run through the Phantom platform. Thespawn.logfile contains both the spawn daemon logs for Python 2 app actions and spawn3 daemon logs for Python 3 app actions.
- identifier
- This value is the action identifier that was specified in the app JSON. As described in the documentation the action name is different from an identifier. The name of the action is displayed on the product UI, the identifier is used for internal action execution purposes. The main advantage of keeping these two separate is to be able to make a name change without having to change the app code. In this case the identifier is
geolocate_ip.
- parameters
- This key contains the list of dictionaries where each dictionary represents a single parameter run. Since this action is expecting a single IP address, it contains one element in the
parameterslist. This can easily be two IPs (and two different action runs), in which case the list looks like the following:
...
...
    "debug_level": 3,
    "identifier": "geolocate_ip",
    "parameters": [
        {
            "ip": "8.8.8.8"
        },
        {
            "ip": "208.67.222.222"
        }
    ]
...
Environment Variables
In order to run your app in a debug environment, you also need to set up some environment variables on the OVA.
PYTHONPATH
Whenever an action is run through the Splunk Phantom platform, the platform sets up the PYTHONPATH so that the BaseConnector and other required modules are available to the App code. In standalone mode this has to be a manual step.
[phantom@appdev phipinfoio]$ export PYTHONPATH=/opt/phantom/lib/:/opt/phantom/www/
[phantom@appdev phipinfoio]$
REQUESTS_CA_BUNDLE
The Splun Phantom platform stores the CA certificate bundle in /opt/phantom/etc/cacerts.pem file. This path is set in the REQUESTS_CA_BUNDLE environment variable, so if an app uses the Python requests module, it directly picks up this bundle. The action path of the bundle is also available to the app through the Python BaseConnector::get_ca_bundle() API. This is a required and manual step while running in standalone mode.
[phantom@appdev phipinfoio]$ export REQUESTS_CA_BUNDLE=/opt/phantom/etc/cacerts.pem
[phantom@appdev phipinfoio]$
As a convenience, you might want to add these to your .bash_profile, so that they are automatically set every time you login. When changed, it will look like as follows:
$ cat .bash_profile
# .bash_profile

# Get the aliases and functions
if [ -f ~/.bashrc ]; then
    . ~/.bashrc
fi

# User specific environment and startup programs

PATH=$PATH:$HOME/bin

export PATH
export PYTHONPATH=/opt/phantom/lib/:/opt/phantom/www/
export REQUESTS_CA_BUNDLE=/opt/phantom/etc/cacerts.pem
Action Implementation
After filling up the test JSON with proper values, expand your terminal window to occupy as much of the screen as possible and run the script as follows.
Command for implementing actions with Python 2.7
Notice the usage of the phenv python2.7 and the /home path to the script.
[phantom@appdev phipinfoio]$ phenv python2.7 /home/phantom/phipinfoio/ipinfoio_connector.py /tmp/ipinfoio-geolocate_ip.json
Command for implementing actions with Python 3
Notice the usage of the phenv python3 and the /py3 path to the script.
[phantom@appdev phipinfoio]$ phenv python3 /opt/phantom/bin/py3/ipinfoio_connector.py /tmp/ipinfoio-geolocate_ip.json
This brings up the PuDB debugger. Since it's been run for the first time, it may bring up a first run dialog box. Note that since it's running in a console mode, it does not support mouse interactions. However, it has a good set of keyboard shortcuts and a quick help dialog box that can be brought up by using the ? key.
PuDB
PUDB's first run dialog can be closed by selecting OK. Optionally, the next screen shows Edit Preferences for PuDB. You can play around with the theme. Depending on your terminal preferences, the dark vim might be a better option. NOTE that once the theme is modified, it's better to quit PuDB (using the q key) and restart the debugging session.
Once all the dialog boxes are closed, the main window displays the PuDB view which is divided into multiple focus windows:
- Code
- Variables
- Stack
- Breakpoint
- Command line
Some quick shortcuts to know (they get displayed in PuDB when you press the ? key):
- V - focus variables
- S - focus stack
- B - focus breakpoint list
- C - focus code
- Ctrl-x - toggle inline command line focus
- o - minimize the PuDB window and display the console.
- q - Quit PuDB, can be used in any window focus except Command line (this will result in a bdb.BdbQuit exception that can be safely ignored)
Shortcuts when in the Code window:
- n - step over ("next")
- s - step into
- c - continue
- r/f - finish current function
- t - run to cursor
- e - show traceback [post-mortem or in exception state]
- b - set breakpoint at current line
Once in the code window you can move up and down using the the up/down arrows or j/k keys.
- Keep pressing the n key until you run the
print(json.dumps(in_json, indent=4))line. - Pressing the o key will take you to the console view after minimizing the PuDB window, you can see the input JSON dumped on the console.
- Press Enter to go back to the PuDB window.
- Now that the PuDB window is up, navigate to the first line of the function
handle_action(self, param)which isret_val = phantom.APP_SUCCESSand press the b key to set a breakpoint. - Press the c key to continue the execution of the rest of the code. For example, call to the
BaseConnector::_handle_actionwhich will validate the input JSON.- If for some reason the input JSON has some errors in it, then the
BaseConnector::_handle_actionfunction will not call theIpinfoIoConnector::handle_actionand return a JSON in ret_val which gets dumped on the console and exit as specified by the code:ret_val = connector._handle_action(json.dumps(in_json), None)
print json.dumps(json.loads(ret_val), indent=4)
- If for some reason the input JSON has some errors in it, then the
- Once the breakpoint in the
handle_actionfunction is reached, step through each line of code until you reach theret_val = self._handle_geolocate_ip(param)line, press the s key to step into this function.
Most of the functions (API) available to an App Connector class are implemented in the BaseConnector class and are therefore accessed through the self object.
App Module Dependencies
There are two main methods to manage your Python module dependencies in the case your App may need them.
- Adding the PIP dependencies in the App's JSON
- Packaged with the App inside a subdirectory called dependencies.
See Specifying pip dependencies for more information.
Take into account that when you run app actions, the following directories are added to your PYTHONPATH:
/opt/phantom/bin/opt/phantom/lib/opt/phantom/www/opt/phantom/apps/<app_install_directory>/opt/phantom/apps/<app_install_directory>/dependencies
| Custom view | Frequently asked questions |
This documentation applies to the following versions of Splunk® Phantom (Legacy): 4.8
Feedback submitted, thanks!