Create a basic chart
In this example you compare the counts of user actions by calculating information about the actions customers have taken on the online store website.
- The number of times each product is viewed
- The number of times each product is added to the cart
- The number of times each product is purchased
Prerequisite
This example requires the productName field from the Enabling field lookups section. You must complete all of those steps before continuing with this section. If you do not configure the field lookups, the searches will not produce the correct results.
Steps
- Start a new search.
- Set the time range to All time.
- Run the following search.
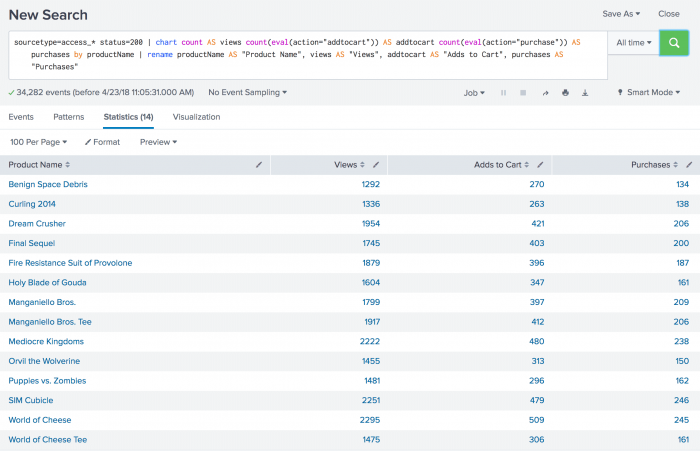
sourcetype=access_* status=200 | chart count AS views count(eval(action="addtocart")) AS addtocart count(eval(action="purchase")) AS purchases by productName | rename productName AS "Product Name", views AS "Views", addtocart AS "Adds to Cart", purchases AS "Purchases"
This search uses thechartcommand to count the number of events that areaction=purchaseandaction=addtocart. The search then uses therenamecommand to rename the fields that appear in the results.
Thechartcommand is a transforming command. The results of the search appear on the Statistics tab.
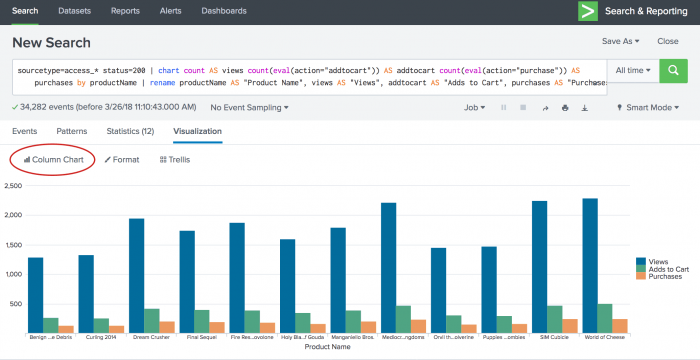
- Click the Visualization tab. The search results appear in a Pie chart.
- Change the display to a Column chart.


Next step
Create an overlay chart and explore visualization options
See also
chart command in the Search Reference
rename command in the Search Reference
Transforming commands in the Search Manual
| Save and share your reports | Create an overlay chart and explore visualization options |
This documentation applies to the following versions of Splunk® Enterprise: 7.1.0, 7.1.1, 7.1.2, 7.1.3, 7.1.4, 7.1.5, 7.1.6, 7.1.7, 7.1.8, 7.1.9, 7.1.10, 7.2.0, 7.2.1, 7.2.2, 7.2.3, 7.2.4, 7.2.5, 7.2.6, 7.2.7, 7.2.8, 7.2.9, 7.2.10
Feedback submitted, thanks!