Explore a dataset
The Explorer view shows the contents of any dataset on the Datasets listing page. You can inspect the contents of any dataset listed on the page, including data model datasets and lookups.
The Explorer view provides several dataset exploration and management capabilities:
- Use two views for dataset exploration:
- View Results, which renders the dataset in a standard table format.
- Summarize Fields, which displays statistical information for each of the fields in your table and their values.
- Set the dataset time range.
- Manage the dataset search job.
- Export the contents of the dataset for a given time range.
- Extend your dataset as a scheduled report.
You can perform the same dataset management actions that you have access to through the Datasets listings page. See Manage datasets and Manage table datasets.
Open the Explorer view for a dataset
Use the Datasets listing page to access the Explorer view for a selected dataset.
- In the Search & Reporting app, click Datasets to open the Datasets listing page.
- Find a dataset you want to explore.
- Click the dataset name to open it in the Explorer view.
Ways to view datasets
The Explorer view gives you two ways to view your dataset. You can View Results or you can Summarize Fields.
View Results
View Results is the default Explorer view. It displays your table dataset as a table, with fields as columns, values in cells, and sample events in rows. It displays the results of a search over the time range set by the time range picker.

Summarize Fields
Click Summarize Fields to see analytical details about the fields in the table. You can see top value distributions, null value percentages, numeric value statistics, and more. These statistics are returned by a search job that runs over the range defined by the time range picker. It is separate from the search job that populates the View Results display.

Set the dataset time range
The time range picker lets you restrict the data displayed by the view to events that fall within specific ranges of time. It applies to search-based dataset types like data model datasets and table datasets. The time range picker used in the Explorer view does not include options for real-time searches.
Lookup table files and lookup definitions get their data from static CSV files and KV store collections, so the time range picker does not apply to them. They display the same rows of data no matter what time range you select.
The time range picker is set to Last 24 hours by default. If your dataset has no results from the last 24 hours, this view is empty at first. You can adjust the time range picker to a range where events are present.
The time range picker gives you several time range definition options. You can choose a pre-set time range, or you can define a custom time range. For help with the time range picker, see Select time ranges to apply to your search in the Search Manual.
Manage the dataset search job
When you enter the Explorer view, a search job runs within the time range set by the time range picker. The search results populate the View Results display.
After you launch a dataset search, a set of controls at the top right of the dataset view lets you manage the search job without leaving the Explorer view. In the middle of this control set are pause/start and stop icons that you can use while the dataset search is in progress.
The Explorer job controls only manage the search job that produces the results displayed in View Results. They do not affect the job that runs when you open the Summarize Fields display of the dataset.
The Job menu lets you access the View Results search job, and information about it. You can use it when a search job is running, paused, or finalized.
- Click Job.
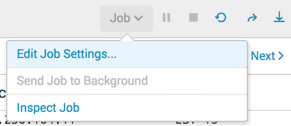
- Choose from the list options.
Action Description Edit Job Settings... Opens the Job Settings dialog box, where you can change the read permissions for the job, extend the job lifespan, and get a URL for the job. You can use the URL to share the job with others or to add a bookmark to the job in your Web browser. Send Job to Background Runs the job on the background. Use this option if the search job is slow to complete. This enables you to work on other activities, including running a new search job. Inspect Job Opens the Search Job Inspector window and displays information and metrics about the search job. You can select this action while the search is running or after the search completes. For more information, see View search job properties in the Search Manual.

For more information, see About jobs and job management in the Search Manual.
Click the Share icon to share the View Results search job. When you select this, the lifetime of the job is extended to 7 days and its read permissions are set to Everyone. For more information about jobs, see About jobs and job management in the Search Manual.
Export the job results
Click the Export icon to export the results of the View Results search job. You can select to output to CSV, XML, or JSON and specify the number of results to export.
For information about other export methods, see Export search results in the Search Manual.
Extend the dataset as a scheduled report
You can extend your dataset to a new scheduled report. The report uses a from command in its base search to reference the dataset that you are viewing. Changes you make to the dataset are passed down to the report. Changes you make to the report are not passed up to the dataset.
Select Manage > Schedule Report to extend the dataset as a scheduled report. This opens the Schedule Report dialog box, where you can create the report schedule and define actions that are triggered each time the report runs. For example, you can arrange to have the Splunk software add the report results to a specific CSV file each time the report runs. You can also define scheduled report actions that email the results to a set of people, or that run scripts.
For more information about using this dialog box to create the report schedule and define actions for it, see Schedule reports, in the Reporting Manual.
For more information about dataset extension, see Extend datasets.
Manage your dataset
The Explorer view gives you the same dataset management capabilities as the Dataset listing page. If you review the contents of a dataset and decide you want to work with it, you do not need to return to the Dataset listing page. You can apply management actions to it from this view.
The Explorer view includes management actions for all dataset types:
- Visualize a dataset with Pivot
- Investigate a dataset with Search
- Edit a dataset
- Update dataset permissions
- Delete a dataset
For more information about these tasks, see Manage datasets.
If you have the Splunk Datasets Add-on installed, the Explorer view includes additional table dataset management capabilities:
- Extend a dataset as a new table dataset
- Clone a table dataset
- Edit table dataset descriptions
- Accelerate table datasets
For more information about these tasks, see Manage table datasets.
| Manage datasets | Table datasets and the Splunk Datasets Add-on |
This documentation applies to the following versions of Splunk® Enterprise: 7.0.0, 7.0.1, 7.0.2, 7.0.3, 7.0.4, 7.0.5, 7.0.6, 7.0.7, 7.0.8, 7.0.9, 7.0.10, 7.0.11, 7.0.13, 7.1.0, 7.1.1, 7.1.2, 7.1.3, 7.1.4, 7.1.5, 7.1.6, 7.1.7, 7.1.8, 7.1.9, 7.1.10, 7.2.0, 7.2.1, 7.2.2, 7.2.3, 7.2.4, 7.2.5, 7.2.6, 7.2.7, 7.2.8, 7.2.9, 7.2.10, 7.3.0, 7.3.1, 7.3.2, 7.3.3, 7.3.4, 7.3.5, 7.3.6, 7.3.7, 7.3.8, 7.3.9, 8.0.0, 8.0.1, 8.0.2, 8.0.3, 8.0.4, 8.0.5, 8.0.6, 8.0.7, 8.0.8, 8.0.9, 8.0.10
Feedback submitted, thanks!