Exploring the Search views
In Part 2, you learned about the types of data that the Splunk platform works with and uploaded the tutorial data into the index. In Part 3, you will learn about the Search app.
Find Splunk Search
- If you are not on the Splunk Home page, click the Splunk logo on the Splunk bar to go to Splunk Home.
- From Splunk Home, click Search & Reporting in the Apps panel.

This opens the Search Summary view in the Search app.
Search Summary view
The Search Summary view includes common elements that you see on other views, including the Applications menu, the Splunk bar, the Apps bar, the Search bar, and the Time Range Picker. Elements that are unique to the Search Summary view are the panels below the Search bar: the How to Search panel, the What to Search panel, and the Search History panel.

| Number | Element | Description |
|---|---|---|
| 1 | Applications menu | Switch between Splunk applications that you have installed. The current application, Search & Reporting app, is listed. This menu is on the Splunk bar. |
| 2 | Splunk bar | Edit your Splunk configuration, view system-level messages, and get help on using the product. |
| 3 | Apps bar | Navigate between the different views in the application you are in. For the Search & Reporting app the views are: Search, Metrics, Datasets, Reports, Alerts, and Dashboards. |
| 4 | Search bar | Specify your search criteria. |
| 5 | Time range picker | Specify the time period for the search, such as the last 30 minutes or yesterday. The default is Last 24 hours. |
| 6 | How to search | Contains links to the Search Manual and the Search Tutorial. |
| 7 | What to search | Shows a summary of the data that is uploaded on to this Splunk instance and that you are authorized to view. |
| 8 | Search history | View a list of the searches that you have run. The search history appears after you run your first search. |
Explore the Data Summary information
Use the Data Summary to view information about your data.
- In the What to Search panel, click Data Summary.
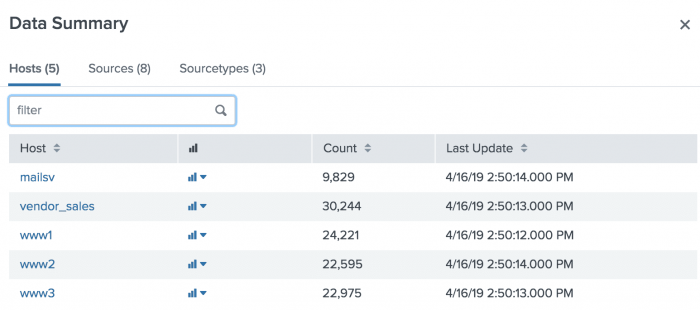
The tabs Hosts, Sources, and Sourcetypes, represent searchable fields in your data. The host, source, and source type fields describe where your data originated.
The host of an event is the host name, IP address, or fully qualified domain name of the network machine from which the event originated. In a distributed environment, you can use the host field to search data from specific machines.
The Host tab lists five hosts. These hosts were identified from thetutorialdata.zipfile that you added to your Splunk deployment.
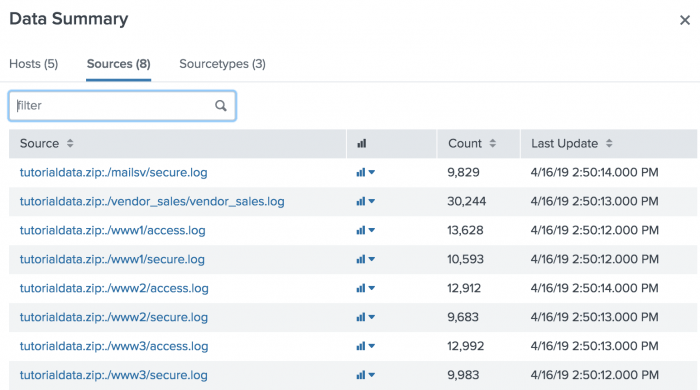
- Click the Sources tab to see the eight sources listed, all of which are log files.
The source of an event is the file or directory path, network port, or script from which the event originated.
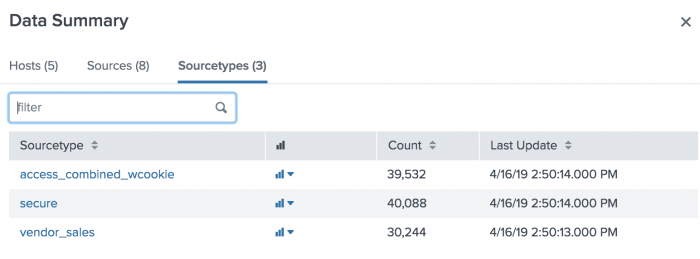
- Click the Sourcetypes tab. The three source types that are in the tutorial data file include the following:
- access_combined_wcookie. Apache web server log files.
- secure. Secure server log files.
- vendor_sales. Global sales vendor information.
The source type of an event tells you what kind of data it is, usually based on how the data is formatted. This classification lets you search for the same type of data across multiple sources and hosts.
Let's explore some of the data. - Click the Sources tab.
- Click tutorialdata.zip:./www1/access.log.
- A new search runs. The events that match the search appear in the lower portion of the screen.
- If no data is returned, expand the time range to Last 7 days and run the search again.


New Search view
The New Search view opens after you run a search.
Some of the elements in this view might be familiar, such as the Apps bar, the Search bar, and the time range picker. Below the Search bar, are the Timeline, the Fields sidebar, and the Events view.

| Number | Element | Description |
|---|---|---|
| 1 | Apps bar | Navigate between the different views in the Search & Reporting app: Search, Metrics, Datasets, Reports, Alerts, and Dashboards. |
| 2 | Search bar | Specify your search criteria. |
| 3 | Time range picker | Specify the time period for the search. |
| 4 | Search action buttons | Actions that you can perform, including working with your search Job, sharing, printing, and exporting your search results. |
| 5 | Search results tabs | The tab that your search results appear on depends on your search. Some searches produce a set of events, which appear on the Events tab. Other searches transform the data in events to produce search results, which appear on the Statistics tab. |
| 6 | Search mode menu | Use the search mode selector to provide a search experience that fits your needs. The modes are Smart (default), Fast, and Verbose. |
| 7 | Timeline | A visual representation of the number of events that occur at each point in time. Peaks or valleys in the timeline can indicate spikes in activity or server downtime. The timeline options are located above the timeline. You can format the timescale, zoom out, or zoom to a selected set of events. |
| 8 | Fields sidebar | Displays a list of the fields discovered in the events. The fields are grouped into Selected Fields and Interesting Fields. |
| 9 | Events viewer | Displays the events that match your search. By default, the most recent event is listed first. In each event, the matching search terms are highlighted. To change the event view, use the List, Format, and Per Page options. |
| 10 | Save As menu | Use the Save As menu to save your search results as a Report, Dashboard Panel, Alert, or Event Type. |
Explore the data source types
- To return to the Search Summary view, click Search in the Apps bar.
- Try a different search. Click Data Summary and click the Sourcetypes tab.
- Click vendor_sales.
The New Search view opens and the Search bar shows the following search criteria.
sourcetype=vendor_sales
Selecting a host, source, or source type from the Data Summary dialog box is a great way to see how your data is turned into events. However, the real power of the Splunk software is in searching all of your data, not segmented parts of it.
Next step
Learn about specifying time ranges in your searches.
See also
View and interact with your Search History in the Search Manual
Why source types matter in Getting Data In
| Upload the tutorial data | Specifying time ranges |
This documentation applies to the following versions of Splunk® Enterprise: 7.3.0, 7.3.1, 7.3.2, 7.3.3, 7.3.4, 7.3.5, 7.3.6, 7.3.7, 7.3.8, 7.3.9
Feedback submitted, thanks!