Add more panels to dashboards
Earlier in this tutorial you ran searches and saved them as reports. In this section, you add those saved reports to an existing dashboard. You will also add more panels based on ad hoc searches.
Add saved reports to a dashboard
Prerequisite
Ensure that you have created the Buttercup Games - Purchases dashboard. This is the dashboard that was created and edited in the previous section of this tutorial, Create dashboards and panels.
Steps
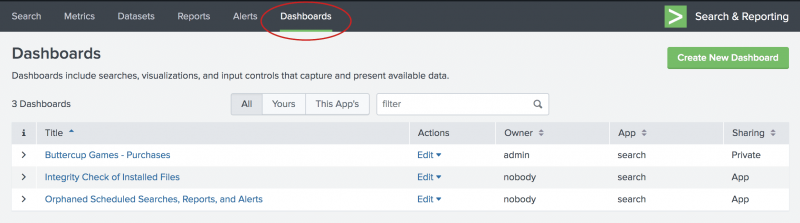
- To display a list of your dashboards, click Dashboards on the Apps bar and select the Buttercup Games - Purchases dashboard.
- In the Actions column, click Edit and select Edit Panels. The Edit Dashboard page opens.
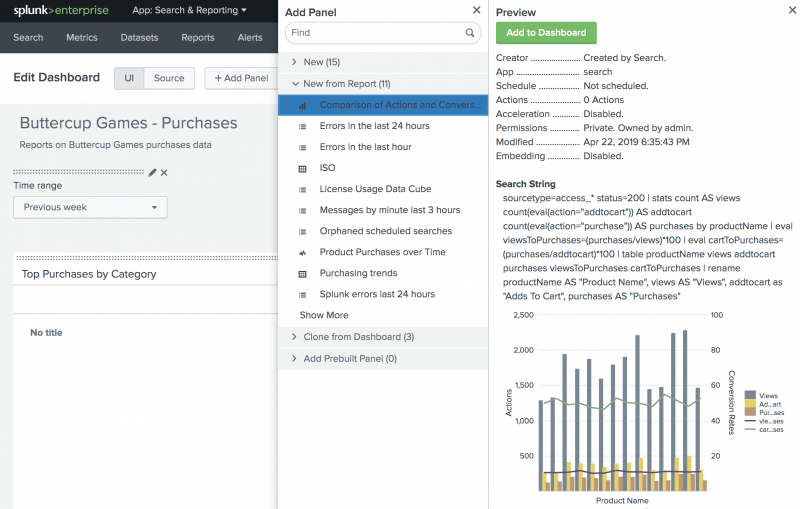
- Click Add Panel.
The Add Panel sidebar menu opens on the right side of the window.
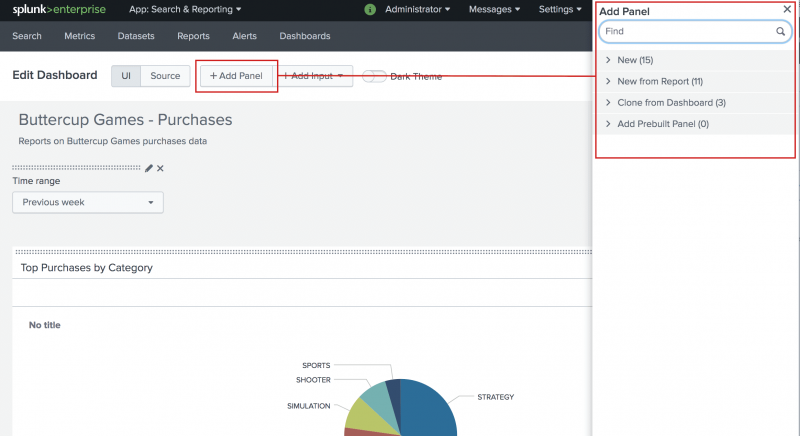
- To add a new panel from an existing report, click New from Report.
The list expands to show reports that you created and saved and built-in reports.
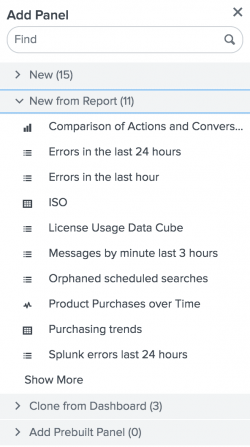
- Select Purchasing trends.
Next to the Add Panel sidebar, the Preview sidebar appears. The preview includes information about the report, the search that the report is based on, and preview of the report itself. This is the sparkline chart report that you created.
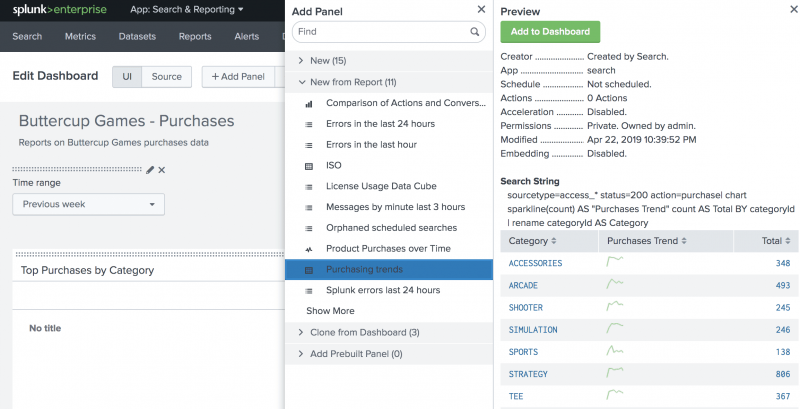
- Click Add to Dashboard.
The new panel is placed at the bottom of the dashboard. - From the Add Panel sidebar menu, select the report Comparison of Actions and Conversion Rates by Product and add it to the dashboard.
- Close the Add Panel sidebar.
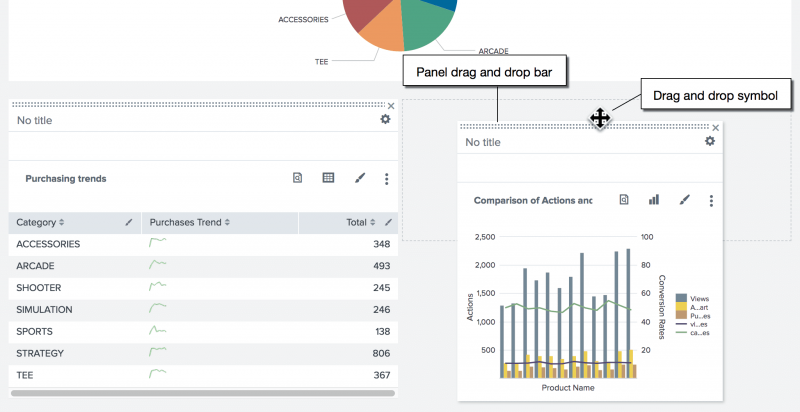
- Rearrange the panels on the dashboard.
Drag and drop a panel by the panel drag and drop bar, which is at the top of the panel. When you drag a panel, a four pointed arrow symbol appears on the drag and drop bar.
- In the Edit Dashboards window, click Save to save your changes to the dashboard.
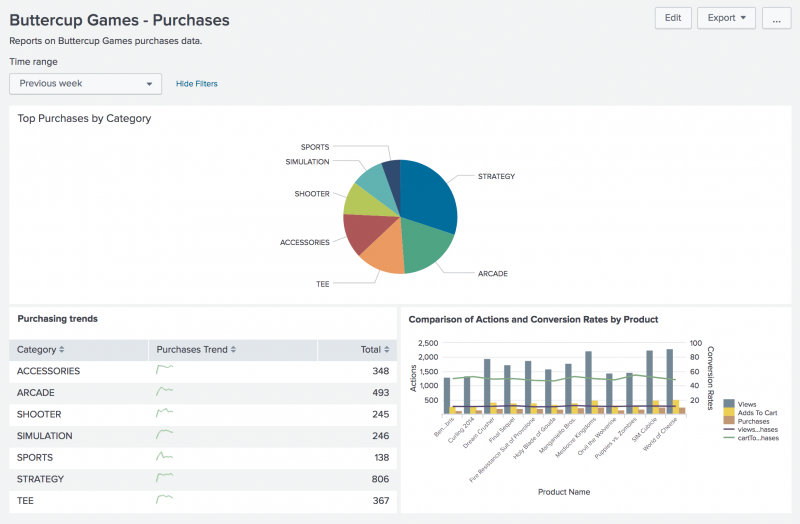
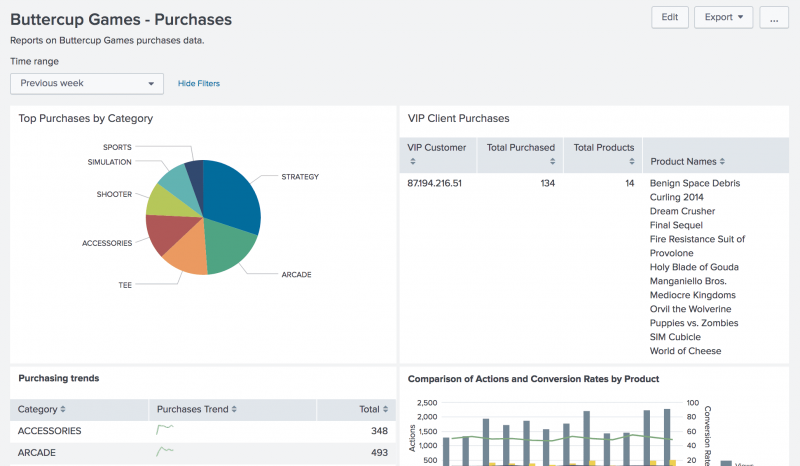
Your finished dashboard should look like the following image.


Adding a search to an existing dashboard
You can save an ad hoc search as a panel in an existing dashboard.
In the Enabling field lookups section in this tutorial, you created the prices_lookup. Let's use that lookup to run the following search.
- Click Search in the Apps bar to start a new search.
- Make sure that the time range is set to All time.
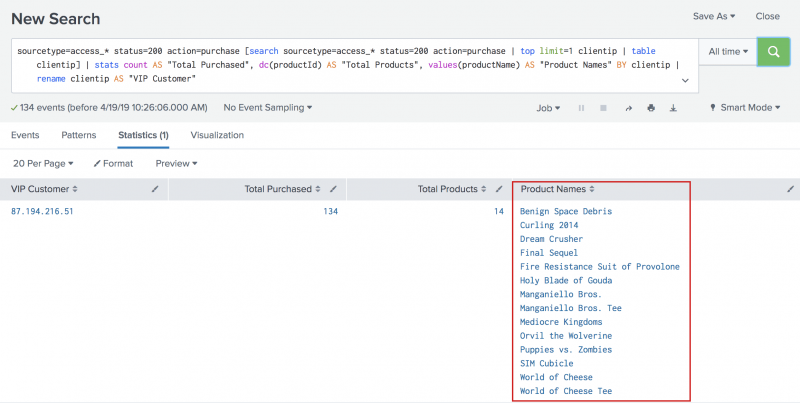
- Run the following search to determine the VIP client and the products that the client purchased.
sourcetype=access_* status=200 action=purchase [search sourcetype=access_* status=200 action=purchase | top limit=1 clientip | table clientip] | stats count AS "Total Purchased", dc(productId) AS "Total Products", values(productName) AS "Product Names" BY clientip | rename clientip AS "VIP Customer"
The following image shows the results of the search.
- Click Save As and choose Dashboard panel.
- For Dashboard, click Existing and select Buttercup Games - Purchases.
- For Panel title, type VIP Client Purchases.
- Click Save.
- Click View Dashboard.
- Click Edit.
- In the dashboard editor, drag the VIP Client Purchases panel next to the Top Purchases by Category pie chart.
- Click Save.
Your dashboard should look like the following image.


The type of panel that you add to a dashboard determines whether you can connect the panel to the shared Time Range Picker.
The Buttercup Games - Purchases dashboard now contains the panels listed in the following table.
| Panel name | Panel source |
|---|---|
| Top Purchases by Category | Ad hoc search |
| Purchasing Trends | Report |
| VIP Client Purchases | Ad hoc search |
| Comparison of Actions and Conversion Rates by Product | Report |
If the panel is based on an ad hoc search, you can connect the panel to the shared Time Range Picker. If the panel is a report, you cannot connect it to the shared Time Range Picker. Reports can be scheduled to run at a set time interval.
To connect the VIP Client Purchases panel to the shared Time Range Picker:
- At the top of the dashboard click Edit.
- In the VIP Client Purchases dashboard panel, click the Edit Search icon. The icon looks like a magnifying glass.
- In the Edit Search dialog box, for Time range select Shared Time Picker (BG_Purchases_Time_Range).
- Click Apply.
- In the Edit Dashboard window, click Save to save the changes to the dashboard.
The VIP Client Purchases panel is now connected to the Time range picker input on the dashboard.
When you change the time range on the dashboard, the panels that are connected to the shared Time Range Picker are updated. The searches that the panels are based on are run again to refresh the panels.
More dashboard actions
After you create a dashboard, use the buttons in the upper right corner to take actions on the dashboard, such as:
- Export the dashboard
- Convert the dashboard to HTML
- Edit the permissions to share the dashboard with other users
Next step
Congratulations! You have completed the Search Tutorial.
To learn more, see Additional Resources.
| Create dashboards and panels | Additional resources |
This documentation applies to the following versions of Splunk® Enterprise: 7.3.0, 7.3.1, 7.3.2, 7.3.3, 7.3.4, 7.3.5, 7.3.6, 7.3.7, 7.3.8, 7.3.9
Feedback submitted, thanks!