anomalies
Description
Use the anomalies command to look for events or field values that are unusual or unexpected.
The anomalies command assigns an unexpectedness score to each event and places that score in a new field named unexpectedness. Whether the event is considered anomalous or not depends on a threshold value. The threshold value is compared to the unexpectedness score. The event is considered unexpected or anomalous if the unexpectedness score is greater than the threshold value.
After you use the anomalies command in a search, look at the Interesting Fields list in the Search & Reporting window. Select the unexpectedness field to see information about the values in your events.
The unexpectedness score of an event is calculated based on the similarity of that event (X) to a set of previous events (P).
The formula for unexpectedness is:
unexpectedness = [s(P and X) - s(P)] / [s(P) + s(X)]
In this formula, s( ) is a metric of how similar or uniform the data is. This formula provides a measure of how much adding X affects the similarity of the set of events. The formula also normalizes the results for the differing event sizes.
Syntax
The required syntax is in bold.
- anomalies
- [threshold=<num>]
- [labelonly=<bool>]
- [normalize=<bool>]
- [maxvalues=<num>]
- [field=<field>]
- [blacklist=<filename>]
- [blacklistthreshold=<num>]
- [by-clause]
Optional arguments
- threshold
- Datatype: threshold=<num>
- Description: A number to represent the upper limit of expected or normal events. If unexpectedness calculated for an event is greater than this threshold limit, the event is considered unexpected or anomalous.
- Default: 0.01
- labelonly
- Datatype: labelonly=<bool>
- Description: Specifies if you want the output result set to include all events or only the events that are above the threshold value. The
unexpectednessfield is appended to all events. Iflabelonly=true, no events are removed. Iflabelonly=false, events that have a unexpectedness score less than the threshold are removed from the output result set. - Default: false
- normalize
- Datatype: normalize=<bool>
- Description: Specifies whether or not to normalize numeric text in the fields. All characters in the field from 0 to 9 are considered identical for purposes of the algorithm. The placement and quantity of the numbers remains significant. When a field contains numeric data that should not be normalized but treated as categories, set
normalize=false. - Default: true
- maxvalues
- Datatype: maxvalues=<num>
- Description: Specifies the size of the sliding set of previous events to include when determining the unexpectedness of a field value. By default the calculation uses the previous 100 events for the comparison. If the current event number is 1000, the calculation uses the values in events 900 to 999 in the calculation. If the current event number is 1500, the calculation uses the values in events 1400 to 1499 in the calculation. You can specify a number between 10 and 10000. Increasing the value of
maxvaluesincreases the total CPU cost per event linearly. Large values have very long search runtimes. - Default: 100
- field
- Datatype: field=<field>
- Description: The field to analyze when determining the unexpectedness of an event.
- Default:
_raw
- blacklist
- Datatype: blacklist=<filename>
- Description: The name of a CSV file that contains a list of events that are expected and should be ignored. Any incoming event that is similar to an event in the blacklist is treated as not anomalous, or expected, and given an unexpectedness score of 0.0. The CSV file must be located in the
$SPLUNK_HOME/var/run/splunk/directory on the search head. If you have Splunk Cloud and want to configure a blacklist file, file a Support ticket.
- blacklistthreshold
- Datatype: blacklistthreshold=<num>
- Description: Specifies a similarity score threshold for matching incoming events to blacklisted events. If the incoming event has a similarity score above the
blacklistthreshold, the event is marked as unexpected. - Default: 0.05
- by-clause
- Syntax: by <fieldlist>
- Description: Use to specify a list of fields to segregate the results for anomaly detection. For each combination of values for the specified fields, the events with those values are treated entirely separately.
Examples
1. Specify a blacklist file of the events to ignore
The following example shows the interesting events, ignoring any events in the blacklist 'boring events'. Sort the event list in descending order, with highest value in the unexpectedness field listed first.
... | anomalies blacklist=boringevents | sort -unexpectedness
2. Find anomalies in transactions
This example uses transactions to find regions of time that look unusual.
... | transaction maxpause=2s | anomalies
3. Identify anomalies by source
Look for anomalies in each source separately. A pattern in one source does not affect that it is anomalous in another source.
... | anomalies by source
4. Specify a threshold when identifying anomalies
This example shows how to tune a search for anomalies using the threshold value.
Start with a search that uses the default threshold value.
index=_internal | anomalies BY group | search group=*
This search looks at events in the _internal index and calculates an unexpectedness score for sets of events that have the same group value.
- The sliding set of events that are used to calculate the
unexpectednessscore for each uniquegroupvalue includes only the events that have the samegroupvalue. - The
searchcommand is used to show events that only include thegroupfield.
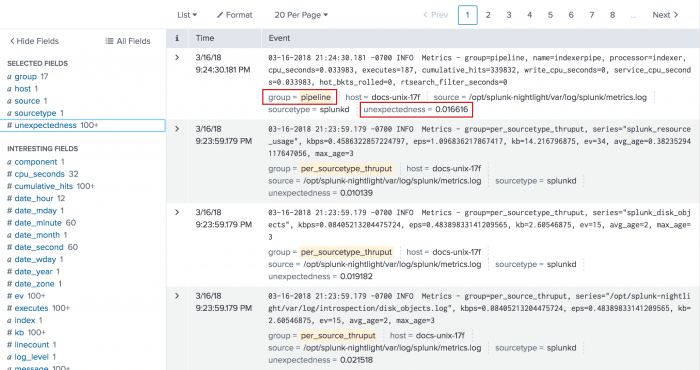
The unexpectedness and group fields appear in the list of Interesting fields. Click on the field name and then click Yes to move the field to the Selected fields list. The fields are moved and also appear in the search results. Your results should look something like the following image.
The key-value pairs in the first event include group=pipeline, name=indexerpipe, processor=indexer, cpu_seconds=0.022, and so forth.
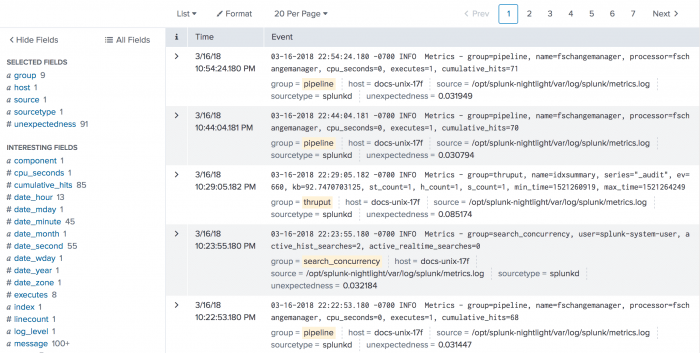
With the default threshold, which is 0.01, you can see that some of these events might be very similar. The next search increases the threshold a little:
index=_internal | anomalies threshold=0.03 by group | search group=*
With the higher threshold value, the timestamps and key-value pairs show more distinction between each of the events.
Also, you might not want to hide the events that are not anomalous. Instead, you can add another field to your events that tells you whether or not the event is interesting to you. One way to do this is with the eval command:
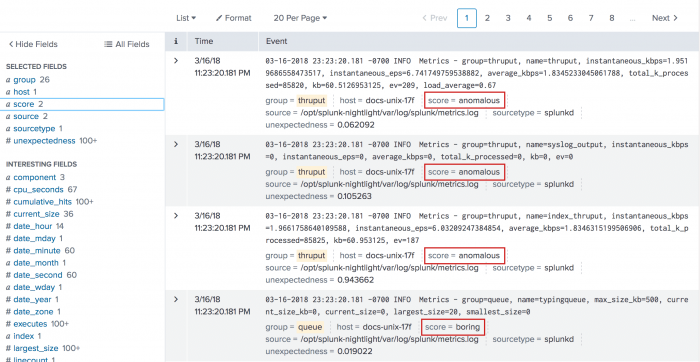
index=_internal | anomalies threshold=0.03 labelonly=true by group | search group=* | eval threshold=0.03 | eval score=if(unexpectedness>=threshold, "anomalous", "boring")
This search uses labelonly=true so that the boring events are still retained in the results list. The eval command is used to define a field named threshold and set it to the threshold value. This has to be done explicitly because the threshold attribute of the anomalies command is not a field.
The second eval command is used to define another new field, score, that is either "anomalous" or "boring" based on how the unexpectedness compares to the threshold value. The following image shows a snapshot of the results.
See also
| analyzefields | anomalousvalue |
This documentation applies to the following versions of Splunk® Enterprise: 7.1.0, 7.1.1, 7.1.2, 7.1.3, 7.1.4, 7.1.5, 7.1.6, 7.1.7, 7.1.8, 7.1.9, 7.1.10, 7.2.0, 7.2.1, 7.2.2, 7.2.3, 7.2.4, 7.2.5, 7.2.6, 7.2.7, 7.2.8, 7.2.9, 7.2.10, 7.3.0, 7.3.1, 7.3.2, 7.3.3, 7.3.4, 7.3.5, 7.3.6, 7.3.7, 7.3.8, 7.3.9, 8.0.0, 8.0.1, 8.0.2, 8.0.3, 8.0.4, 8.0.5, 8.0.6, 8.0.7, 8.0.8, 8.0.9, 8.0.10


 Download manual
Feedback submitted, thanks!