Time functions
earliest(X)
Description
Returns the chronologically earliest seen occurrence of a value of a field X.
Usage
- This function processes field values as strings.
- You can use the
earliest(X)function with thechart,mstats,stats,timechart, andtstatscommands.
Basic example
| This example uses the sample data from the Search Tutorial. To try this example on your own Splunk instance, you must download the sample data and follow the instructions to get the tutorial data into Splunk. Use the time range All time when you run the search. |
You run the following search to locate invalid user login attempts against a sshd (Secure Shell Daemon). You use the table command to see the values in the _time, source, and _raw fields.
sourcetype=secure invalid user "sshd[5258]" | table _time source _raw
The results appear on the Statistics tab and look something like this:
| _time | source | _raw |
|---|---|---|
| 2018-04-30 00:15:05 | tutorialdata.zip:./mailsv/secure.log | Mon Apr 28 2018 00:15:05 mailsv1 sshd[5258]: Failed password for invalid user tomcat from 67.170.226.218 port 1490 ssh2 |
| 2018-04-29 00:15:04 | tutorialdata.zip:./www2/secure.log | Thu May 01 2018 00:15:04 www2 sshd[5258]: Failed password for invalid user brian from 130.253.37.97 port 4284 ssh2 |
| 2018-04-29 00:15:02 | tutorialdata.zip:./www3/secure.log | Wed Apr 30 2018 00:15:02 www3 sshd[5258]: Failed password for invalid user operator from 222.169.224.226 port 1711 ssh2 |
| 2018-04-28 00:15:01 | tutorialdata.zip:./www1/secure.log | Mon Apr 28 2018 00:15:01 www1 sshd[5258]: Failed password for invalid user rightscale from 87.194.216.51 port 3361 ssh2 |
| 2018-04-28 00:15:05 | tutorialdata.zip:./mailsv/secure.log | Thu May 01 2018 00:15:05 mailsv1 sshd[5258]: Failed password for invalid user testuser from 194.8.74.23 port 3626 ssh2 |
| 2018-04-27 00:15:01 | tutorialdata.zip:./www1/secure.log | Sun Apr 27 2018 00:15:01 www1 sshd[5258]: Failed password for invalid user redmine from 91.208.184.24 port 3587 ssh2 |
You extend the search using the earliest function.
sourcetype=secure invalid user "sshd[5258]" | table _time source _raw | stats earliest(_raw)
The search returns the event with the _time value 2018-04-27 00:15:01, which is the event with the oldest timestamp.
| _time | source | _raw |
|---|---|---|
| 2018-04-27 00:15:01 | tutorialdata.zip:./www1/secure.log | Sun Apr 27 2018 00:15:01 www1 sshd[5258]: Failed password for invalid user redmine from 91.208.184.24 port 3587 ssh2 |
earliest_time(x)
Description
Returns the UNIX time of the chronologically earliest-seen occurrence of a given field value.
Usage
- This function processes field values as strings.
- You can use the
earliest_time(X)function with thestats,mstats, andtstatscommands. - If you have metrics data, you can use
earliest_time(x)in conjunction withearliest(x),latest(x), andlatest_time(x)to calculate the rate of increase for a counter. Alternatively you can use therate(x)counter to do the same thing.
Basic example
The following search runs against metric data. It is designed to return the earliest UNIX time values on every minute for each metric_name that begins with deploy.
| mstats earliest_time(_value) where index=_metrics metric_name=deploy* BY metric_name span=1m
The results appear on the Statistics tab and look something like this:
| _time | metric_name | earliest_time(_value) |
|---|---|---|
| 2018-11-11 18:14:00 | deploy-connections.nCurrent | 1541988860.000000 |
| 2018-11-11 18:14:00 | deploy-connections.nStarted | 1541988860.000000 |
| 2018-11-11 18:14:00 | deploy-server.volumeCompletedKB | 1541988860.000000 |
| 2018-11-11 18:15:00 | deploy-connections.nCurrent | 1541988922.000000 |
| 2018-11-11 18:15:00 | deploy-connections.nStarted | 1541988922.000000 |
| 2018-11-11 18:15:00 | deploy-server.volumeCompletedKB | 1541988922.000000 |
latest(X)
Description
Returns the chronologically latest seen occurrence of a value of a field X.
Usage
- This function processes field values as strings.
- You can use the
latest(X)function with thechart,mstats,stats,timechart, andtstatscommands.
Basic example
| This example uses the sample data from the Search Tutorial. To try this example on your own Splunk instance, you must download the sample data and follow the instructions to get the tutorial data into Splunk. Use the time range All time when you run the search. |
You run the following search to locate invalid user login attempts against a specific sshd (Secure Shell Daemon). You use the table command to see the values in the _time, source, and _raw fields.
sourcetype=secure invalid user "sshd[5258]" | table _time source _raw
The results appear on the Statistics tab and look something like this:
| _time | source | _raw |
|---|---|---|
| 2018-04-28 00:15:05 | tutorialdata.zip:./mailsv/secure.log | Mon Apr 28 2018 00:15:05 mailsv1 sshd[5258]: Failed password for invalid user tomcat from 67.170.226.218 port 1490 ssh2 |
| 2018-05-01 00:15:04 | tutorialdata.zip:./www2/secure.log | Thu May 01 2018 00:15:04 www2 sshd[5258]: Failed password for invalid user brian from 130.253.37.97 port 4284 ssh2 |
| 2018-04-30 00:15:02 | tutorialdata.zip:./www3/secure.log | Wed Apr 30 2018 00:15:02 www3 sshd[5258]: Failed password for invalid user operator from 222.169.224.226 port 1711 ssh2 |
| 2018-04-28 00:15:01 | tutorialdata.zip:./www1/secure.log | Mon Apr 28 2018 00:15:01 www1 sshd[5258]: Failed password for invalid user rightscale from 87.194.216.51 port 3361 ssh2 |
| 2018-05-01 00:15:05 | tutorialdata.zip:./mailsv/secure.log | Thu May 01 2018 00:15:05 mailsv1 sshd[5258]: Failed password for invalid user testuser from 194.8.74.23 port 3626 ssh2 |
| 2018-04-27 00:15:01 | tutorialdata.zip:./www1/secure.log | Sun Apr 27 2018 00:15:01 www1 sshd[5258]: Failed password for invalid user redmine from 91.208.184.24 port 3587 ssh2 |
You extend the search using the latest function.
sourcetype=secure invalid user "sshd[5258]" | table _time source _raw | stats latest(_raw)
The search returns the event with the _time value 2018-05-01 00:15:05, which is the event with the most recent timestamp.
| _time | source | _raw |
|---|---|---|
| 2018-05-01 00:15:05 | tutorialdata.zip:./mailsv/secure.log | Thu May 01 2018 00:15:05 mailsv1 sshd[5258]: Failed password for invalid user testuser from 194.8.74.23 port 3626 ssh2 |
latest_time(x)
Description
Returns the UNIX time of the chronologically latest-seen occurrence of a given field value.
Usage
- This function processes field values as strings.
- You can use the
latest_time(X)function with thestats,mstats, andtstatscommands. - If you have metrics data, you can use
latest_time(x)in conjunction withearliest(x),latest(x), andearliest_time(x)to calculate the rate of increase for a counter. Alternatively, you can use therate(x)counter to do the same thing.
Basic example
The following search runs against metric data. It is designed to return the latest UNIX time values in the past 60 minutes for metrics with names that begin with queue.
| mstats latest_time(_value) where index=_metrics metric_name=queue.* BY metric_name span=1m
The results appear on the Statistics tab and look something like this:
| _time | metric_name | earliest_time(_value) |
|---|---|---|
| 2018-11-13 14:43:00 | queue.current_size | 1542149039.000000 |
| 2018-11-13 14:43:00 | queue.current_size_kb | 1542149039.000000 |
| 2018-11-13 14:43:00 | queue.largest_size | 1542149039.000000 |
| 2018-11-13 14:43:00 | queue.max_size_kb | 1542149039.000000 |
| 2018-11-13 14:43:00 | queue.smallest_size | 1542149039.000000 |
| 2018-11-13 14:44:00 | queue.current_size | 1542149070.000000 |
| 2018-11-13 14:44:00 | queue.current_size_kb | 1542149070.000000 |
| 2018-11-13 14:44:00 | queue.largest_size | 1542149070.000000 |
| 2018-11-13 14:44:00 | queue.max_size_kb | 1542149070.000000 |
| 2018-11-13 14:44:00 | queue.smallest_size | 1542149070.000000 |
per_day(X)
Description
Returns the values of field X, or eval expression X, for each day.
Usage
- You can use the
per_day(X)function with thetimechartcommand.
Basic examples
The following example returns the values for the field total for each day.
... | timechart per_day(total)
The following example returns the results of the eval expression eval(method="GET")) AS Views .
... | timechart per_day(eval(method="GET")) AS Views
Extended example
| This example uses the sample dataset from the Search Tutorial but should work with any format of Apache Web access log. Download the data set from this topic in the Search Tutorial and follow the instructions to upload it to your Splunk deployment. |
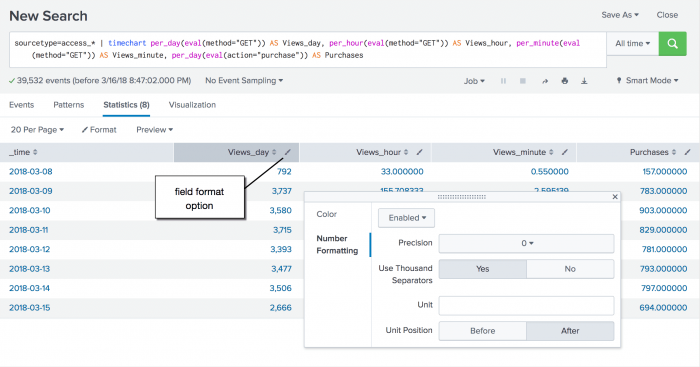
This search uses the per_day() function and eval expressions to determine how many times the web pages were viewed and how many times items were purchased. The results appear on the Statistics tab.
sourcetype=access_* | timechart per_day(eval(method="GET")) AS Views_day, per_day(eval(action="purchase")) AS Purchases
To determine the number of Views and Purchases for each hour, minute, or second you can add the other time functions to the search. For example:
sourcetype=access_* | timechart per_day(eval(method="GET")) AS Views_day, per_hour(eval(method="GET")) AS Views_hour, per_minute(eval(method="GET")) AS Views_minute, per_day(eval(action="purchase")) AS Purchases
Use the field format option to change the number formatting for the field values.
per_hour(X)
Description
Returns the values of field X, or eval expression X, for each hour.
Usage
- You can use the
per_hour(X)function with thetimechartcommand.
Basic examples
The following example returns the values for the field total for each hour.
... | timechart per_hour(total)
The following example returns the the results of the eval expression eval(method="POST")) AS Views .
... | timechart per_hour(eval(method="POST")) AS Views
per_minute(X)
Description
Returns the values of field X, or eval expression X, for each minute.
Usage
- You can use the
per_minute(X)function with thetimechartcommand.
Basic examples
The following example returns the values for the field total for each minute.
... | timechart per_minute(total)
The following example returns the the results of the eval expression eval(method="GET")) AS Views .
... | timechart per_minute(eval(method="GET")) AS Views
per_second(X)
Description
Returns the values of field X, or eval expression X, for each second.
Usage
- You can use the
per_second(X)function with thetimechartcommand.
Basic examples
The following example returns the values for the field kb for each second.
... | timechart per_second(kb)
rate(x)
Description
Returns the per-second rate change of the value of a counter metric. Represents (latest(X) - earliest(X)) / (latest_time(X) - earliest_time(X)).
Usage
- You can use the
rate(X)function with thestats,mstats, andtstatscommands. - Provides the per-second rate change for accumulating counter metrics. Accumulating counters report the total counter value since the last counter reset.
- Requires the
earliest(X)andlatest(X)values of the field to be numerical, and theearliest_time(X)andlatest_time(X)values to be different. - Requires at least two metrics data points in the search time range.
- Should be used to provide rate information about single, rather than multiple, counters.
- Counter metrics are expected to increase, but can be reset. The
rate(x)function adjusts the largest value reset if there is at least one reset of the counter metric.If the latest measurement of the metric does not equal the maximum measurement of the metric, the calculation changes to (latest(X)-earliest(X)+max(X)/ (latest_time(X)-earliest_time(X)).
Basic example
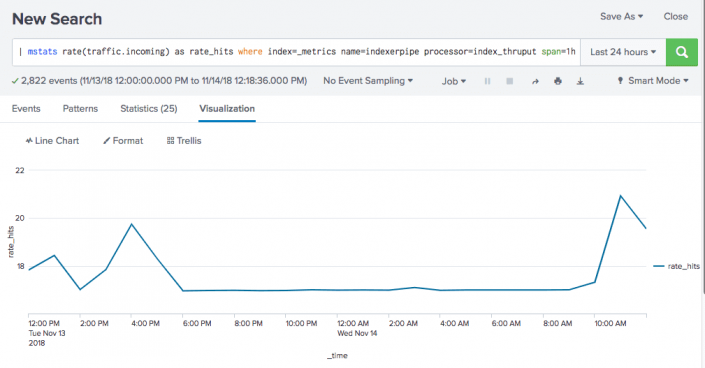
The following search runs against metric data. It provides the hourly hit rate for a metric that provides measurements of incoming web traffic. It uses the processor filter to ensure that it is not reporting on multiple metric series (name and processor combinations).
| mstats rate(traffic.incoming) as rate_hits where index=_metrics name=indexerpipe processor=index_thruput span=1h
The resulting chart shows you that the counter hit rate for the traffic.incoming metric spiked at 1 pm, 4 pm, and 11 am, but otherwise remained stable.
| Multivalue stats and chart functions | Date and time format variables |
This documentation applies to the following versions of Splunk® Enterprise: 7.2.0, 7.2.1, 7.2.2, 7.2.3, 7.2.4, 7.2.5, 7.2.6, 7.2.7, 7.2.8, 7.2.9, 7.2.10, 7.3.0, 7.3.1, 7.3.2, 7.3.3, 7.3.4, 7.3.5, 7.3.6, 7.3.7, 7.3.8, 7.3.9, 8.0.0, 8.0.1, 8.0.2, 8.0.3, 8.0.4, 8.0.5, 8.0.6, 8.0.7, 8.0.8, 8.0.9, 8.0.10


 Download manual
Feedback submitted, thanks!