Create a report from a sparkline chart
In this example, you create a report that shows the trends in the number of purchases made over time. This example uses sparkline charts. Sparklines are inline charts that appear in the search results table and are designed to display time-based trends associated with the primary key of each row.
For searches that use the stats and chart commands, you can add sparkline charts to the results table.
This example uses the productName field from the Enabling field lookups section of this tutorial.
If you do not configure the field lookups, the searches in this section will not produce the correct results.
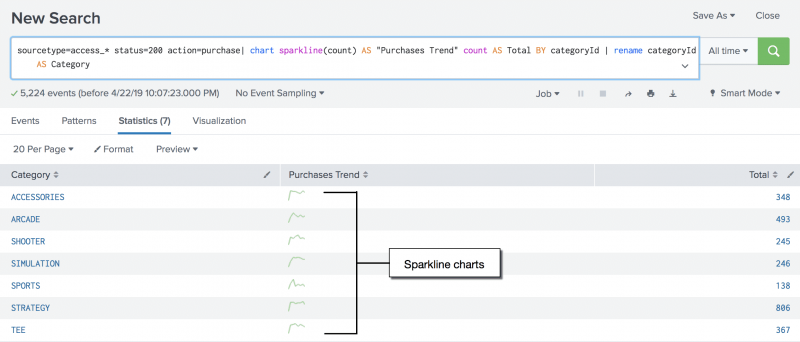
- Start a new search.
- Set the time range to All time.
- Run the following search.
sourcetype=access_* status=200 action=purchase| chart sparkline(count) AS "Purchases Trend" count AS Total BY categoryId | rename categoryId AS CategoryThis search uses the
chartcommand to count the number of purchases by usingaction="purchase". The search specifies the purchases made for each product by usingcategoryId. The difference is that the count of purchases is now an argument of thesparkline()function.When you rename a column using the AS keyword, names that are more than one word need to be in quotation marks. In this search quotation marks are around the name Purchases Trend but not around the name Category.
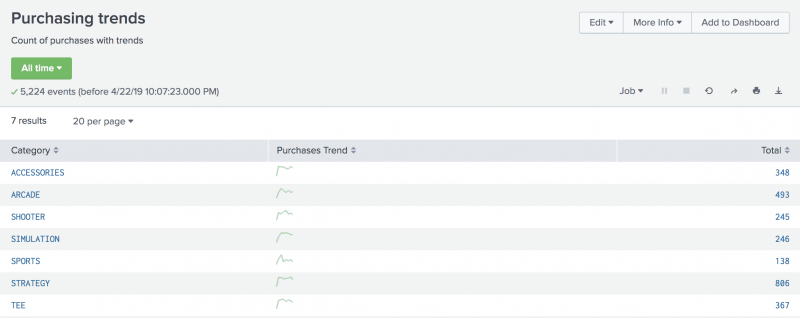
- Click Save As and select Report.
- In the Save Report As dialog box, for Title type
Purchasing trends. - For Description, type
Count of purchases with trends. - Click Save.
- In the confirmation dialog box, click View. Your report should look like this.


Next step
This completes Part 6 of the Search Tutorial.
Up to now, you have saved searches as Reports. Continue to Part 7: Creating dashboards, where you learn how to save searches and reports as dashboard panels.
See also
chart command in the Search Reference
Add sparklines to your search results in the Search Manual
| Create a report from a custom chart | About dashboards |
This documentation applies to the following versions of Splunk® Enterprise: 7.3.0, 7.3.1, 7.3.2, 7.3.3, 7.3.4, 7.3.5, 7.3.6, 7.3.7, 7.3.8, 7.3.9, 8.0.0, 8.0.1, 8.0.2, 8.0.3, 8.0.4, 8.0.5, 8.0.6, 8.0.7, 8.0.8, 8.0.9, 8.0.10, 8.1.0, 8.1.1, 8.1.2, 8.1.3, 8.1.4, 8.1.5, 8.1.6, 8.1.7, 8.1.8, 8.1.9, 8.1.10, 8.1.11, 8.1.12, 8.1.13, 8.1.14
Feedback submitted, thanks!