Part 8 Add an input
Buttercup Games sells many different games, and on the dashboard, it's difficult to scan through all the games to find the one you're looking for. In this part of the tutorial, add a drop-down menu input to your dashboard to filter the visualizations by any game you choose. After you add an input, you must define the input token name and apply it to data sources powering the visualizations you want to filter.
- Select the add input icon (
 ) in the editing toolbar, and then select Dropdown.
- For Dashboard Studio in Splunk Enterprise versions 8.3.1 and earlier, skip to step 3.
- In the Configuration panel, give your input the following title and token name.
- Title: Select Game Category
- Token name: category
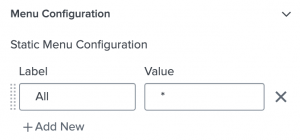
- In the Menu Configuration section, remove (
 ) the default rows so that there is only one value in the table:
- In the Data Configurations section, select + Set up Primary Data Source.
- Select + Create Search and name it Games Categories.
- Add your search. For this tutorial, copy and paste the following search into the Search with SPL box:
index=main sourcetype=access_* action=purchase status=200
| stats count by categoryId
- Expand the Code section and change the Data Source ID to ds_category.
- Select Apply & Close.
- For Dashboard Studio in Splunk Enterprise versions 8.3.1 and earlier, add the following to your input via source editor.
"dataSources": { "primary": "ds_games" } - Select select categoryId (string) in the Dynamic Menu Label Field drop-down menu and in the Dynamic Menu Value Field drop-down menu.
- For Dashboard Studio in Splunk Enterprise versions 8.3.1 and earlier, skip this step.
- Expand the Code section and change the Input ID to input_select_category.
- Select the donut chart visualization, and then select the edit icon (
 ) next to the Revenue by Game data source.
 - Add your input token to the search by copying and pasting the following SPL after
status=200:categoryId="$category$"
You can interact with the visualizations powered by a data source after adding your newly defined token to that data source. After you edit the Revenue by Game data source, its SPL looks like this:
index=main sourcetype=access_* action=purchase status=200 categoryId="$category$"
| stats count values(price) as Price by productName productId
| table productName productId count Price
| eval revenue=count*Price
| fields productName revenue
| rename productName as "Game" revenue as "Revenue"
| sort -Revenue
- Select Apply & Close.
- Now select the table visualization, and then select the edit icon () next to the Most Purchased Games data source.
- Add your input token to the search by copying and pasting the following SPL after
status=200:categoryId="$category$"
After editing the Most Purchased Games data source, its SPL looks like this:
index=main sourcetype=access_* action=purchase status=200 categoryId="$category$"
| stats count as Purchases by productName price
| table productName Purchases price
| eval Revenue=Purchases*price
| table productName Purchases Revenue
| sort -Purchases | rename productName as "Game"
| head 8
- Select Apply & Close.
- To test your input, select a category in the drop-down menu and watch the table, donut chart, and single value display data reflecting your selection.
- Reset the drop-down to All.

After completing Part 7, your chart looks similar to this:

Next step
You've completed Part 8 of the Splunk Dashboard Studio tutorial.
Now you can filter visualizations using the drop-down input. Next, use drilldown to set tokens on visualizations. Continue to Part 9: Add a drilldown.
| Part 7 Add a map | Part 9 Add a drilldown |
This documentation applies to the following versions of Splunk® Enterprise: 9.0.3, 9.0.4, 9.0.5, 9.0.6, 9.0.7, 9.0.8, 9.0.9, 9.0.10
Feedback submitted, thanks!