geom
Description
The geom command adds a field, named geom, to each result. This field contains geographic data structures for polygon geometry in JSON. These geographic data structures are used to create choropleth map visualizations.
For more information about choropleth maps, see Mapping data in the Dashboards and Visualizations manual.
Syntax
geom [<featureCollection>] [allFeatures=<boolean>] [featureIdField=<string>] [gen=<double>] [min_x=<double>] [min_y=<double>] [max_x=<double>] [max_y=<double>]
Required arguments
None.
Optional arguments
- featureCollection
- Syntax: <geo_lookup>
- Description: Specifies the geographic lookup file that you want to use. Two geographic lookup files are included by default with Splunk software:
geo_us_statesandgeo_countries. You can install your own geographic lookups from KMZ or KLM files. See Usage for more information.
- allFeatures
- Syntax: allFeatures=<bool>
- Description: Specifies that the output include every geometric feature in the feature collection. When a shape has no values, any aggregate fields, such as
averageorcount, display zero when this argument is used. Additional rows are appended for each feature that is not already present in the search results when this argument is used. See Examples. - Default: false
- featureIdField
- Syntax: featureIdField=<field>
- Description: If the event contains the featureId in a field named something other than "featureId", use this option to specify the field name.
- gen
- Syntax: gen=<double>
- Description: Specifies generalization, in the units of the data. For example,
gen=0.1generalizes, or reduces the size of, the geometry by running the Douglass Puiker Ramer algorithm on the polygons with a parameter of 0.1 degrees. - Default: 0.1
- min_x
- Syntax: min_x=<double>
- Description: The X coordinate for the bottom-left corner of the bounding box for the geometric shape. The range for the coordinate is -180 to 180. See Usage for more information.
- Default: -180
- min_y
- Syntax: min_y=<double>
- Description: The Y coordinate for the bottom-left corner of the bounding box for the geometric shape. The range for the coordinate is -90 to 90.
- Default: -90
- max_x
- Syntax: max_x=<double>
- Description: The X coordinate for the upper-right corner of the bounding box for the geometric shape. The range for the coordinate -180 to 180.
- Default: 180
- max_y
- Syntax: max_y=<double>
- Description: The Y coordinate for the upper-right corner of the bounding box for the geometric shape. The range is -90 to 90.
- Default: 90
Usage
Specifying a lookup
To use your own lookup file in Splunk Enterprise, you can define the lookup in Splunk Web or edit the transforms.conf file. If you use Splunk Cloud Platform, use Splunk Web to define lookups.
Define a geospatial lookup in Splunk Web
- To create a geospatial lookup in Splunk Web, you use the Lookups option in the Settings menu. You must add the lookup file, create a lookup definition, and can set the lookup to work automatically. See Define a geospatial lookup in Splunk Web in the Knowledge Manager Manual.
Configure a geospatial lookup in transforms.conf
- Edit the
%SPLUNK_HOME%\etc\system\local\transforms.conffile, or create a new file namedtransforms.confin the%SPLUNK_HOME%\etc\system\localdirectory, if the file does not already exist. See How to edit a configuration file in the Admin Manual. - Specify the name of the lookup stanza in the
transforms.conffile for thefeatureCollectionargument. - Set
external_type=geoin the stanza. See Configure geospatial lookups in the Knowledge Manager Manual.
Specifying no optional arguments
When no arguments are specified, the geom command looks for a field named featureCollection and a field named featureIdField in the event. These fields are present in the default output from a geoindex lookup.
Clipping the geometry
The min_x, min_y, max_x, and max_y arguments are used to clip the geometry. Use these arguments to define a bounding box for the geometric shape. You can specify the minimum rectangle corner (min_x, min_y) and the maximum rectangle corner (max_x, max_y). By specifying the coordinates, you are returning only the data within those coordinates.
Testing lookup files
You can use the inputlookup command to verify that the geometric features on the map are correct. The syntax is | inputlookup <your_lookup>.
For example, to verify that the geometric features in built-in geo_us_states lookup appear correctly on the choropleth map:
- Run the following search:
| inputlookup geo_us_states - On the Visualizations tab, change to a Choropleth Map.
- zoom in to see the geometric features. In this example, the states in the United States.
Testing geometric features
You can create an arbitrary result to test the geometric features.
To show how the output appears with the allFeatures argument, the following search creates a simple set of fields and values.
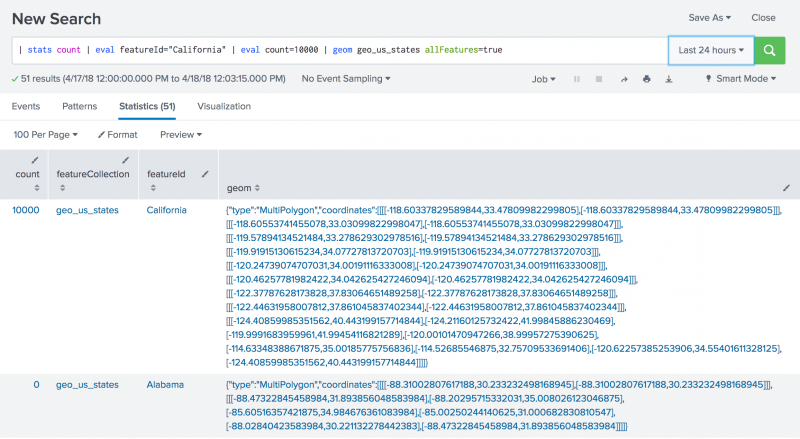
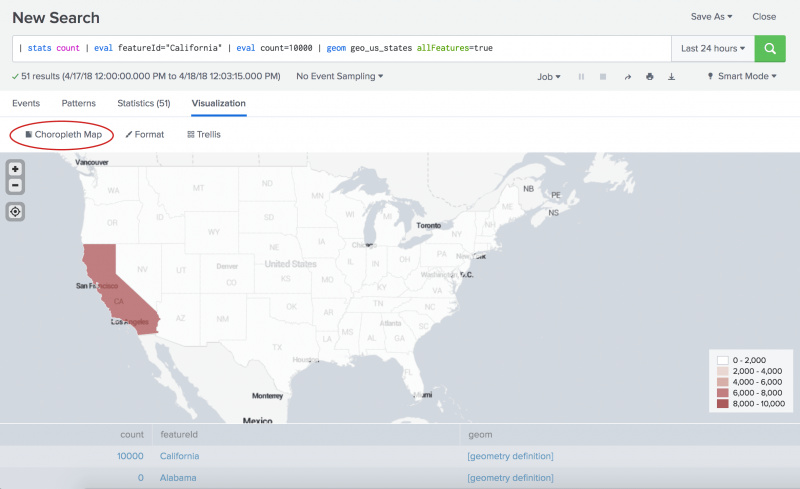
| stats count | eval featureId="California" | eval count=10000 | geom geo_us_states allFeatures=true
- The search uses the
statscommand, specifying thecountfield. A single result is created that has a value of zero ( 0 ) in thecountfield. - The
evalcommand is used to add thefeatureIdfield with value of California to the result. - Another
evalcommand is used to specify the value 10000 for thecountfield. You now have a single result with two fields,countandfeatureId.
- When the
geomcommand is added, two additional fields are added,featureCollectionandgeom.
The following image shows the results of the search on the Statistics tab.
The following image shows the results of the search on the Visualization tab. Make sure that the map is a Choropleth Map. This image is zoomed in to show more detail.
Examples
1. Use the default settings
When no arguments are provided, the geom command looks for a field named featureCollection and a field named featureId in the event. These fields are present in the default output from a geospatial lookup.
...| geom
2. Use the built-in geospatial lookup
This example uses the built-in geo_us_states lookup file for the featureCollection.
...| geom geo_us_states
3. Specify a field that contains the featureId
This example uses the built-in geo_us_states lookup and specifies state as the featureIdField. In most geospatial lookup files, the feature IDs are stored in a field called featureId. Use the featureIdField argument when the event contains the feature IDs in a field named something other than "featureId".
...| geom geo_us_states featureIdField="state"
4. Show all geometric features in the output
The following example specifies that the output include every geometric feature in the feature collection. If no value is present for a geometric feature, zero is the default value. Using the allFeatures argument causes the choropleth map visualization to render all of the shapes.
...| geom geo_us_states allFeatures=true
5. Use the built-in countries lookup
The following example uses the built-in geo_countries lookup. This search uses the lookup command to specify shorter field names for the latitude and longitude fields. The stats command is used to count the feature IDs and renames the featureIdField field as country. The geom command generates the information for the chloropleth map using the renamed field country.
... | lookup geo_countries latitude AS lat, longitude AS long | stats count BY featureIdField AS country | geom geo_countries featureIdField="country"
6. Specify the bounding box for the geometric shape
This example uses the geom command attributes that enable you to clip the geometry by specifying a bounding box.
... | geom geo_us_states featureIdField="state" gen=0.1 min_x=-130.5 min_y=37.6 max_x=-130.1 max_y=37.7
See also
Mapping data in the Dashboards and Visualizations manual.
| gentimes | geomfilter |
This documentation applies to the following versions of Splunk Cloud Platform™: 9.3.2411 (latest FedRAMP release), 8.2.2203, 9.0.2205, 9.0.2208, 8.2.2112, 8.2.2201, 8.2.2202, 9.0.2209, 9.0.2303, 9.0.2305, 9.1.2308, 9.1.2312, 9.2.2403, 9.2.2406, 9.3.2408


 Download manual
Feedback submitted, thanks!