pivot
Description
The pivot command makes simple pivot operations fairly straightforward, but can be pretty complex for more sophisticated pivot operations. Fundamentally this command is a wrapper around the stats and xyseries commands.
The pivot command does not add new behavior, but it might be easier to use if you are already familiar with how Pivot works. See the Pivot Manual. Also, read how to open non-transforming searches in Pivot.
Run pivot searches against a particular data model object. This requires a large number of inputs: the data model, the data model object, and pivot elements.
Syntax
| pivot <datamodel-name> <object-name> <pivot-element>
Required arguments
- datamodel-name
- Syntax: <string>
- Description: The name of the data model to search.
- objectname
- Syntax: <string>
- Description: The name of a data model object to search.
- pivot element
- Syntax: (<cellvalue>)* (SPLITROW <rowvalue>)* (SPLITCOL colvalue [options])* (FILTER <filter expression>)* (LIMIT <limit expression>)* (ROWSUMMARY <true | false>)* (COLSUMMARY <true | false>)* (SHOWOTHER <true | false>)* (NUMCOLS <num>)* (rowsort [options])*
- Description: Use pivot elements to define your pivot table or chart. Pivot elements include cell values, split rows, split columns, filters, limits, row and column formatting, and row sort options. Cell values always come first. They are followed by split rows and split columns, which can be interleaved, for example:
avg(val), SPLITCOL foo, SPLITROW bar, SPLITCOL baz.
Cell value
- <cellvalue>
- Syntax: <function>(fieldname) [AS <label>]
- Description: Define the values of a cell and optionally rename it. Here,
labelis the name of the cell in the report.
The set of allowed functions depend on the data type of the fieldname:
- Strings: list, values, first, last, count, and distinct_count (dc)
- Numbers: sum, count, avg, max, min, stdev, list, and values
- Timestamps: duration, earliest, latest, list, and values
- Object or child counts: count
Descriptions for row split-by elements
- SPLITROW <rowvalue>
- Syntax: SPLITROW <field> [AS <label>] [RANGE start=<value> end=<value> max=<value> size=<value>] [PERIOD (auto | year | month | day | hour | minute | second)] [TRUELABEL <label>] [FALSELABEL <label>]
- Description: You can specify one or more of these options on each SPLITROW. The options can appear in any order. You can rename the <field> using "AS <label>", where "label" is the name of the row in the report.
Other options depend on the data type of the <field> specified:
- RANGE applies only for numbers. You do not need to specify all of the options (start, end, max, and size).
- PERIOD applies only for timestamps. Use it to specify the period to bucket by.
- TRUELABEL applies only for booleans. Use it to specify the label for true values.
- FALSELABEL applies only for booleans. Use it to specify the label for false values.
Descriptions for column split-by elements
- SPLITCOL colvalue <options>
- Syntax: fieldname [ RANGE start=<value> end=<value> max=<value> size=<value>] [PERIOD (auto | year | month| day | hour | minute | second)] [TRUELABEL <label>] [FALSELABEL <label>]
- Description: You can have none, some, or all of these options on each SPLITCOL. They may appear in any order.
Other options depend on the data type of the field specified (fieldname):
- RANGE applies only for numbers. The options (start, end, max, and size) do not all have to be specified.
- PERIOD applies only for timestamps. Use it to specify the period to bucket by.
- TRUELABEL applies only for booleans. Use it to specify the label for true values.
- FALSELABEL applies only for booleans. Use it to specify the label for false values.
Descriptions for filter elements
- Filter <filter expression>
- Syntax: <fieldname> <comparison-operator> <value>
- Description: The expression used to identify values in a field. The comparison operator that you use depends on the type of field value.
- Strings: is, contains, in, isNot, doesNotContain, startsWith, endsWith, isNull, isNotNull
- For example: ... filter fieldname in (value1, value2, ...)
- ipv4: is, contains, isNot, doesNotContain, startsWith, isNull, isNotNull
- Numbers: =, !=, <, <=, >, >=, isNull, isNotNull
- Booleans: is, isNull, isNotNull
Descriptions for limit elements
- Limit <limit expression>
- Syntax: LIMIT <fieldname> BY <limittype> <number> <stats-function>(<fieldname>)
- Description: Use to limit the number of elements in the pivot. The
limittypeargument specifies where to place the limit. The valid values aretoporbottom. Thenumberargument must be a positive integer. You can use any stats function, such asmin,max,avg, andsum. - Example: LIMIT foo BY TOP 10 avg(bar)
Usage
The pivot command is a report-generating command. See Command types.
Generating commands use a leading pipe character and should be the first command in a search.
Examples
Example 1: This command counts the number of events in the "HTTP Requests" object in the "Tutorial" data model.
| pivot Tutorial HTTP_requests count(HTTP_requests) AS "Count of HTTP requests"
This can be formatted as a single value report in the dashboard panel:
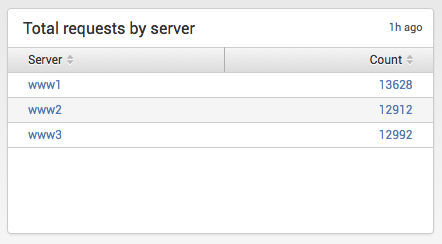
Example 2: Using the Tutorial data model, create a pivot table for the count of "HTTP Requests" per host.
| pivot Tutorial HTTP_requests count(HTTP_requests) AS "Count" SPLITROW host AS "Server" SORT 100 host
See also
| overlap | predict |
This documentation applies to the following versions of Splunk Cloud Platform™: 9.3.2411 (latest FedRAMP release), 8.2.2112, 8.2.2201, 8.2.2203, 8.2.2202, 9.0.2205, 9.0.2208, 9.0.2209, 9.0.2303, 9.0.2305, 9.1.2308, 9.1.2312, 9.2.2403, 9.2.2406, 9.3.2408


 Download manual
Feedback submitted, thanks!