This topic discusses navigating the different views in Splunk Web, the Splunk web browser interface.
About Splunk Home
The Splunk Home page is your interactive portal to the data and apps in your Splunk deployment. The first time you log into your Splunk deployment, you land on the Splunk Home page. All of the apps that you have access to appear on this page.
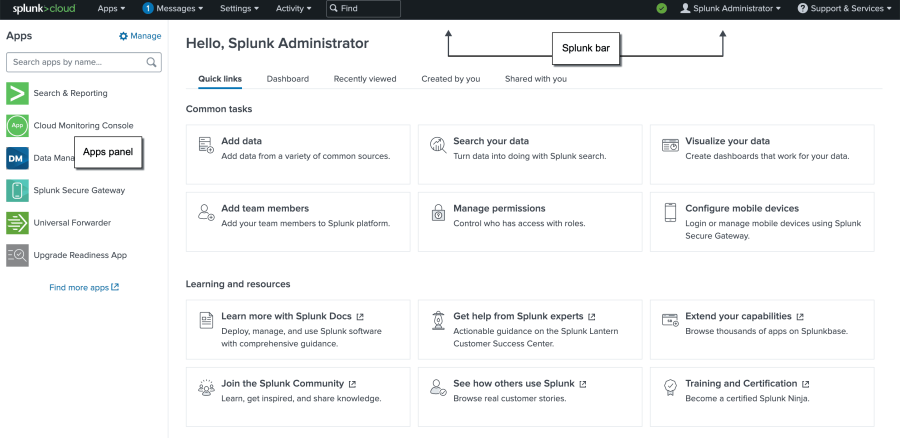
There are minor differences between the Splunk Home page for Splunk Enterprise and Splunk Cloud Platform. The following image shows the Home page for a user with administrator access on Splunk Cloud Platform:
Your Splunk account might be configured to start in another view instead of Splunk Home, such as Search or Pivot in the Search & Reporting app.
Apps panel
The Apps panel lists the apps which are installed on your Splunk instance and that you have permission to use. Select the app from the list to open it.
By default the Search & Reporting app, which is often referred to as the Search app, is pinned to the top of the list. For apps that you use frequently, you can pin the apps to move them to the top of the list.
Tabs
Splunk Home has a set of tabs that you can use to gain access to information. The following table describes these tabs:
| Tab | Description |
|---|---|
| Quick links | Use this tab to access common tasks and other resources. The options listed under Common tasks depend on your user authorizations and role. |
| Dashboard | Use this tab to access your favorite dashboard faster. You can add a dashboard created either using Simple XML or created through Dashboard Studio as your home dashboard. |
| Recently viewed | This tab shows the list of knowledge objects that you accessed in the last 30 days, including alerts, dashboards, datasets, and reports. |
| Created by you | This tab shows all of the knowledge objects that you have created, organized by knowledge object type. |
| Shared with you | This tab shows all the knowledge objects that you have access to, organized by knowledge object type. |
About the Splunk bar
Use the Splunk bar to navigate Splunk Web. You can use the Splunk bar to switch between apps, add data, manage settings and edit your Splunk configuration, view system-level messages, monitor the activity of your search jobs and alerts, and get help using Splunk software.
The Splunk bar in another view, such as the Search view in the Search & Reporting app, also includes the Apps menu next to the Splunk logo. Use the Apps menu to quickly switch between the Splunk applications that you have installed on your Splunk instance.
The following image shows the Splunk bar in the Search app in Splunk Enterprise. The Splunk bar in Splunk Cloud Platform has the same elements and menus.
All system-level error messages are listed on the Messages menu. When you have a new message to review, a numerical notification appears next to the Messages menu. The notification indicates the number of messages that you have.
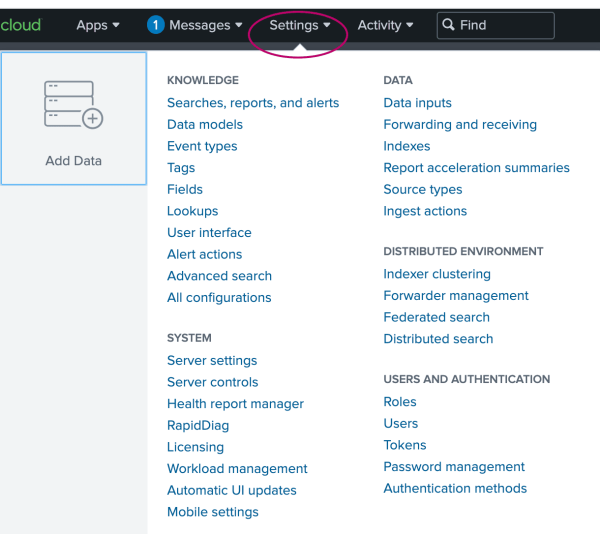
The Settings menu lists the configuration pages for knowledge objects, distributed environment settings, system and licensing, data, and authentication settings. If you do not see some of these options, you do not have the permissions to view or edit those options.
The following image shows the Settings menu in Splunk Cloud Platform:

The Settings menu in Splunk Enterprise contains the same options, however there are several additional large icons to the left of the menu to access the Explore Data and Monitoring Console pages.
The Activity menu provides shortcuts to the Jobs and Triggered alerts views.
- Click Jobs to open the search jobs manager window, where you can view and manage currently running searches.
- Click Triggered Alerts to view scheduled alerts that are triggered.
Find search box
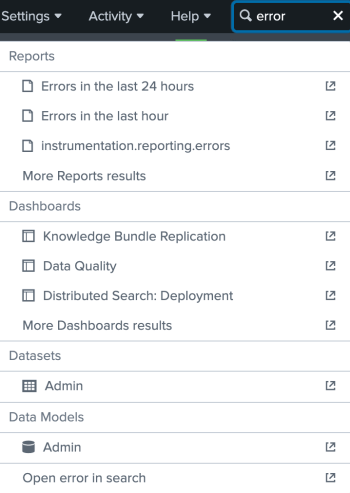
To search for objects within your Splunk deployment, use the Find search box. The Find search box performs matches that are not case sensitive on the ID, labels, and descriptions in built-in and saved objects. For example, if you type error, it returns the knowledge objects that contain that term.
The saved objects, where they exist, are organized into the following categories: Reports, Dashboards, Datasets, and Data models.
You can also run a search for the word error in your event and metric data. Select Open error in search to run a search in the Search & Reporting app, using the word you specified in the Find search box.
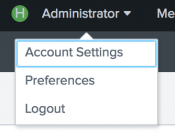
Use the user menu to edit your account settings, change preferences, or to log out of the Splunk instance.
- If you installed Splunk, for example to step through the Search Tutorial, the user menu displays "Administrator" because that is the default user name for a new installation.
- If you are a user, the name on the user menu is your Splunk user name.
Preferences
Through the Preferences menu, you can:
- Set a time zone that is different than the default system time zone.
- Set a default application other than Splunk Home.
- Restart background search jobs when the Splunk software is restarted.
- Change the background to a dark theme. The default is a light theme.
Help and Support
For assistance, such as to access the Splunk Support portal and Splunk Answers, to file a bug, or to get help on a specific page, use the menu the corresponds to your Splunk instance:
- Splunk Cloud Platform
- Use the Support and Services menu on the Splunk bar.
- Splunk Enterprise
- Use the Help menu on the Splunk bar.
Return to Splunk Home
Select the Splunk logo on the Splunk bar to return to Splunk Home from any other view in Splunk Web.
See also
| Get started with Search | About the search language |
This documentation applies to the following versions of Splunk Cloud Platform™: 9.2.2403, 9.0.2303, 9.0.2305, 9.1.2308, 9.1.2312


 Download manual
Feedback submitted, thanks!