Configure observability previews
Splunk Cloud Platform users can see previews of observability data that correlate to search results in the Search & Reporting application (the Search app) when you configure observability previews. An administrator must connect your Splunk Cloud Platform and Splunk Observability Cloud accounts. Users can then see previews of observability data in the Related Content panel and jump into Splunk Observability Cloud in context for troubleshooting.
Prerequisites
To configure observability previews in Splunk Cloud Platform, a user must have the sc_admin role in Splunk Cloud Platform and the admin role in Splunk Observability Cloud.
Connect accounts
To connect accounts and activate data correlation previews, an administrator must do the following:
1. In Splunk Observability Cloud, retrieve an API access token. See Create and manage organization access tokens using Splunk Observability Cloud to learn how.
2. In Splunk Cloud Platform, select the Discover Splunk Observability Cloud application from the navigation panel.
3. On the Configuration tab, select Connect accounts.
If the configuration page does not load when you configure Related Content, see the following section, "Configuration error". Reach out to your Splunk Cloud Platform account team if you have any questions.
4. In the Access Token field, paste the Splunk Observability Cloud API access token you retrieved in step 1. In the Realm field, enter your Splunk Observability Cloud realm.
Supported realms include us0, us1, us2, eu0, jp0, and au0.
5. Select Automatic UI updates, then turn on the toggle next to Splunk Observability Cloud and select Save. You must turn on automatic UI updates to see real-time Splunk Observability Cloud data in the Search app.
6. In Splunk Cloud Platform, ensure that the appropriate users have the following capabilities:
- search
- read_o11y_content
- rest_properties_get
- rest_access_server_endpoints
- request_remote_tok
Note that these capabilities are turned on by default for the user role. Ensure that an administrator doesn't deactivate them.
7. The sc_admin, poweruser, and user roles have the read_o11y_content role automatically active. If you have users who you do not want to access this feature, turn off the read_o11y_content capability in that role.
Configuration error
If the configuration page does not load when you configure Related Content, use the REST API to push passwords.conf for the Discover Splunk Observability Cloud app and replace the <text> with relevant values.
Someone with the "edit_storage_passwords" capability must run the following script:
curl -k -u "<ec_username>:<ec_password_xxxx>" https://<searchhead_url>:8089/servicesNS/nobody/splunk_app_for_splunk_o11y_cloud/storage/passwords -d name=o11y_access_token -d password=<o11y_token_xxxx> -d realm=<realm>
After successfully running the script, go to Automatic UI Updates in the Settings page, activate Splunk Observability Cloud UI Updates, then select Save. Performing the preceding steps enables Related Content in your environment.
Test your connection
After connecting your accounts, you can see previews of Splunk Observability Cloud data that correlate with your Splunk Cloud Platform logs.
To test the connection and preview capability, follow these steps:
1. Do a search in the Search & Reporting application in Splunk Cloud Platform.
2. Select a sample log to show details.
3. Next to any field for which there is correlated Splunk Observability Cloud data, you see the Preview link. Check for the Preview link next to the host.name, service.name, and trace_id fields.
4. Select Preview to open the Related Content panel.
The Related Content panel shows the following Splunk Observability Cloud data previews:
| Splunk Cloud Platform field | Splunk Observability Cloud related data |
|---|---|
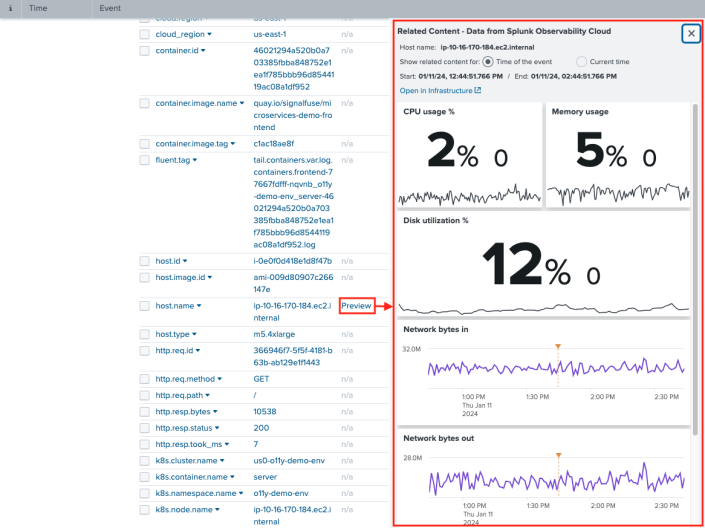
| host.name | CPU utilization, memory usage, disk utilization, network bytes in, network bytes out, tags |
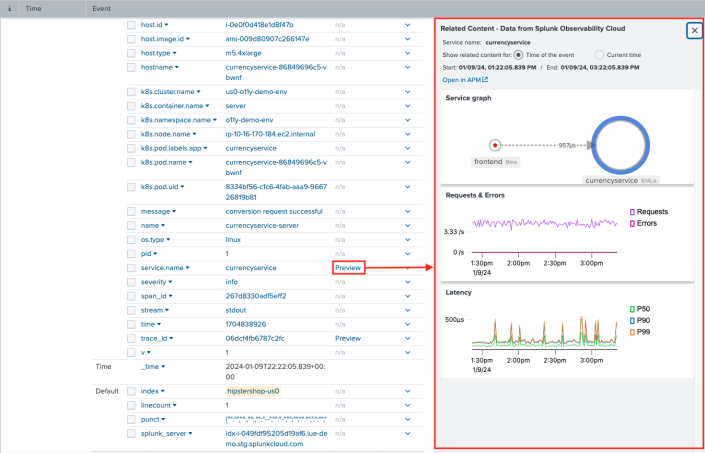
| service.name | Service dependency map, latency graph, error rate graph |
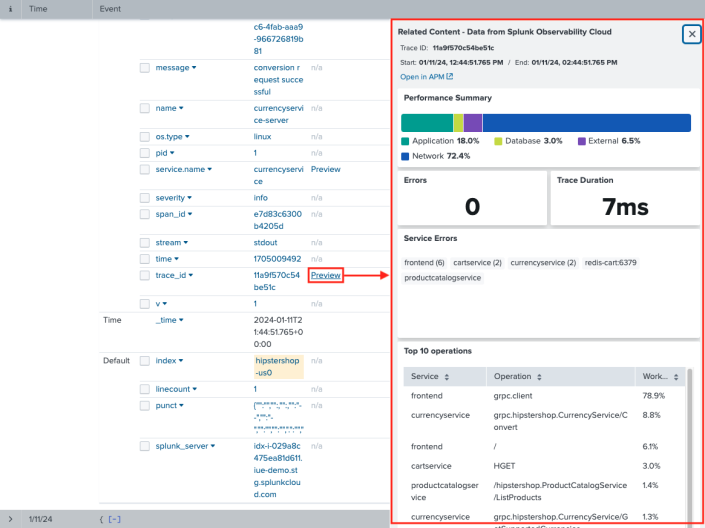
| trace_id | Errors, trace duration, service errors, top 10 operations |
| k8s.cluster.name | Nodes, total memory (bytes), top nodes by pods, top nodes by CPU capacity usage (%), top nodes by memory usage (bytes) |
| container.id | CPU usage (CPU units), memory usage (bytes), filesystem usage (bytes) |
| k8s.pod.name | Active containers, network bytes/sec, CPU usage per pod (CPU units), memory usage (%) |
| k8s.node.name | Pods, total memory (bytes), node condition, CPU cores, top 10 CPU used per pod (%), top 10 memory used per pod (bytes), node workloads, tags |
Related Content previews: Examples
The following sections show sample previews of observability data in the Search app and how to drill down on the data in context in Splunk Observability Cloud.
Host data previews
The following screenshot shows previews of host.name data from Splunk Observability Cloud on the Related Content panel:
Select Open in Infrastructure to open the host data in context in Splunk Infrastructure Monitoring.
Service data previews
The following screenshot shows previews of service.name data from Splunk Observability Cloud on the Related Content panel:
Select Open in APM to open the service data in context in Splunk APM.
Trace data previews
The following screenshot shows previews of trace_id data from Splunk Observability Cloud on the Related Content panel:
Select Open in APM to open the trace data in context in Splunk APM.
See also
To learn how to use Related Content to preview observability data, see Preview Splunk Observability Cloud data.
| Preview events | Preview observability data in the Related Content panel |
This documentation applies to the following versions of Splunk Cloud Platform™: 9.1.2312


 Download manual
Feedback submitted, thanks!