Using dynamic options in the visual editor
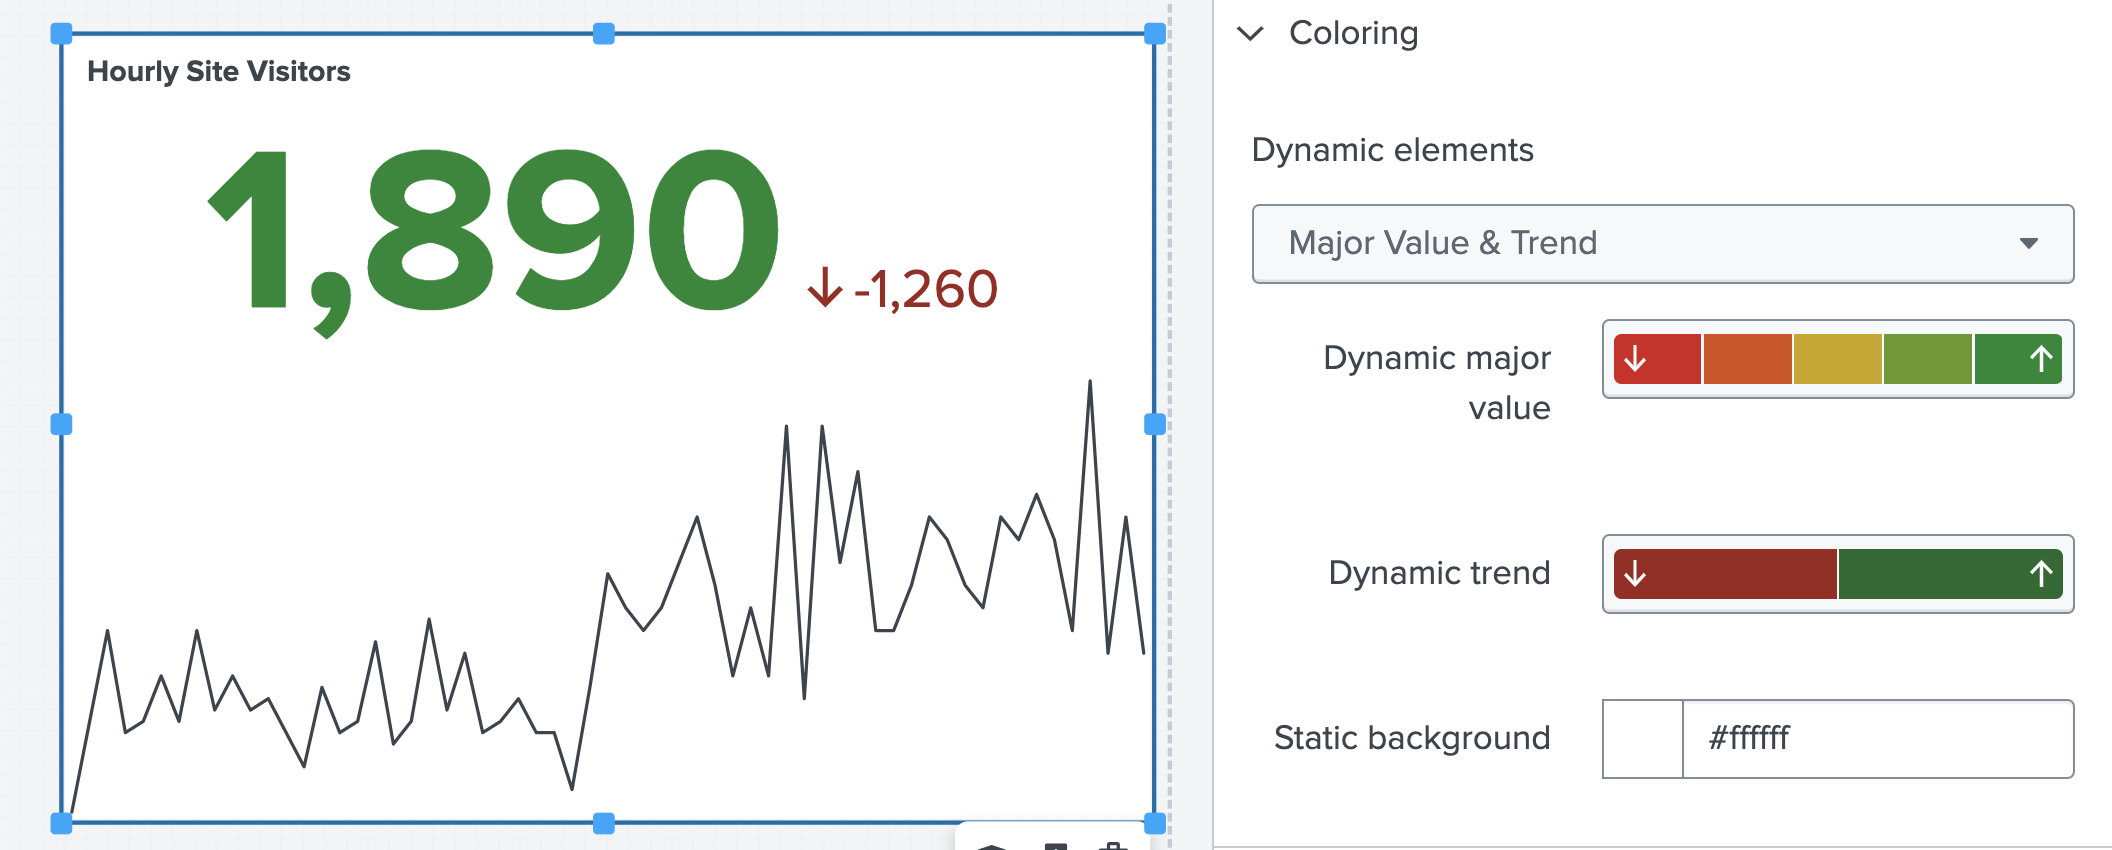
You can use dynamic coloring for a variety of visualizations. For example, to visualize changes in hourly site visitors, you can set color thresholds for different data ranges to illustrate if the hourly site visitor numbers met or fell short of hourly expectations. In this example, there are 5 color thresholds:
- Green: More than 1,800 visitors
- Light green: 1,500 to 1,800 visitors
- Yellow: 1,200 to 1,500 visitors
- Orange: 1,000 to 1,200 visitors
- Red: Less than 1,000 visitors
The following image shows a single value visualization of hourly site visitors with dynamic coloring applied to the visualization.

In the previous image, both Dynamic major value and Dynamic trend are dynamically colored. Dynamic trend is the change in visitor numbers from the previous hour to the current hour. In the current hour, the visitor numbers declined by 1,260 visitors. Because the trend was negative, the number and arrow demonstrating trend are both dynamically colored red.
The values you provide to the visual editor for color thresholds are inclusive for lower bounds and noninclusive for upper bounds. For example, in the orange threshold from 1,000 to 1,200 visitors, a value of 1,000 visitors is colored orange, but a value of 1,200 is colored yellow, not orange.
For more details about dynamically configuring single value visualizations, see Single value visualizations. For a complete list of single value dynamic options, see Source options for single value visualizations.
Dynamic options and dynamic options syntax
Whether you set dynamic options in the UI or write them in the source editor, all dynamic options follow dynamic options syntax (DOS). For example, when you set the dynamic element majorValue to a single value visualization in the visual editor UI, DOS is created in the source code to assess the value in the visualization against fixed color thresholds. You can use DOS to customize your dynamic visualizations in the source code editor or the code editor.
The code editor is a collapsible section accessible in the configuration panel after you select a visualization. When you select the code editor in the configurational panel, you can edit the source code directly related to the selected visualization and see your changes reflected in real time. If you edit source code in the source code editor, you cannot test your edits until you exit the source code editor.
See What is a dashboard definition? for more details about editing the visualization source code directly.
Dynamic options syntax structure
Dynamic options syntax is the written code used in Dashboard Studio for visualization options and dynamic menu options for inputs. DOS structure has several parts, each separated by a pipe ( | ).
| DOS Part | What it does | Required? |
|---|---|---|
| Data Source | An originating data source, which can be a visualization data source such as a primary data source or visualization options such as sparklineValues. The location of your data sources, searches, and options for each search you create in the visual editor. | Yes |
| Selector functions | Identifies the data from the data source associated with the visualization. A dynamic option can have one or multiple selector functions. | No |
| Formatting function | Formats the selected data. | Yes |
A typical DOS structure looks like the following:
Option: "> [data source] | [selector functions] | [formatting function]"
Example of conditional coloring
The following example represents a single value visualization that dynamically updates the color of its trend based on a change in hourly site visitors. A downward change prompts the red threshold, and an upward change prompts the green threshold. This example is fully configurable in the visual editor UI, and the following source code is for illustrative purposes.
The following image shows a downward trend of site visitors.

The following source code block contains the source code for this single value visualization.
{
    "type": "splunk.singlevalue",
    "options": {
        "trendValue": "> sparklineValues | delta(-2)",
        "sparklineValues": "> primary | seriesByName('total')",
        "trendColor": "> trendValue | rangeValue(trendColorEditorConfig)",
        "majorValue": "> sparklineValues | lastPoint()"
    },
    "dataSources": {
        "primary": "ds_oYg1KwKB"
    },
    "title": "Hourly Site Visitors",
    "description": "",
    "context": {
        "trendColorEditorConfig": [
            {
                "value": "#9E2520",
                "to": 0
            },
            {
                "value": "#1C6B2D",
                "from": 0
            }
        ]
    },
    "showProgressBar": false,
    "showLastUpdated": false
}
As seen in the following source code, the trendColor option follows the DOS structure Main structure: "> [data source] | [formatting function]". The trendColor option uses the data from trendValue as its data source, and the formatting function rangeValue applies colors to the visualization based on a range of colors from trendColorEditorConfig:
"trendColor": "> trendValue | rangeValue(trendColorEditorConfig)"
The trendColorEditorConfig option is defined in the source code as having the value #9E2520, a red hexadecimal color, when the value passed from trendColor to rangeValue is below 0. Conversely, when the value passed from the trendColor to rangeValue option is 0 or higher, the trendColorEditorConfig option is defined in the source code as having the value #1C6B2D, a green hexadecimal color. Configurations are always in the context section of the source code.
When you initially create a visualization with the visual editor UI, default dynamic options and values, such as majorValue and trendValue, do not appear in the source editor until you change an option from its default. If you manually change an option from its default, the associated dynamic options and values appear in the source editor.
To learn more about how you can customize DOS to your own needs, see Modify and write dynamic options syntax.
| Dynamic options in Dashboard Studio | Modify and write dynamic options syntax |
This documentation applies to the following versions of Splunk Cloud Platform™: 9.3.2411 (latest FedRAMP release), 9.0.2305, 9.1.2308, 9.1.2312, 9.2.2403, 9.2.2406, 9.3.2408
 Download manual
Feedback submitted, thanks!