Add a Splunk Observability Cloud service map to Dashboard Studio dashboards
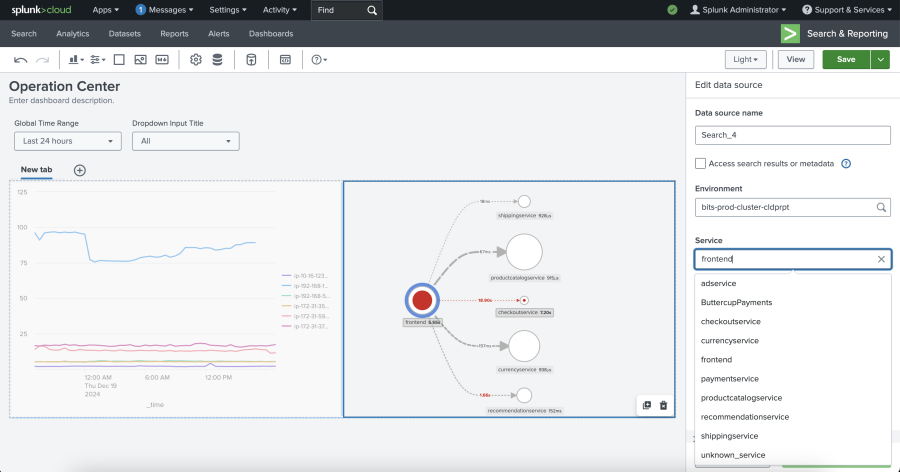
You can add a service map for services monitored in Splunk Observability Cloud into Dashboard Studio. A service map allows you to see dependencies and connections among your instrumented and inferred services in APM at a glance on the dashboard of your choice in Splunk Cloud Platform. You can then identify performance bottlenecks and error propagation side-by-side with your other charts and graphs.
To add a service map into Dashboard Studio from Splunk Observability Cloud, follow these steps:
1. In Dashboard Studio, open the dashboard that you want to add a service map to.
2. Select Edit, then select the Edit data source icon. A Data source overview panel opens on the right.
3. In the Splunk Observability Cloud section, select + Create splunk observability cloud.
4. On the New data source panel, enter a name for the data source as you want it to appear on the dashboard.
5. In the Data type drop-down menu, select Service Map.
6. You can optionally enter an environment. If you do not enter an environment, the default is all environments.
7. Enter a service name, then select Apply and close.
8. On the Data source overview panel, select Save.
The service map appears on the dashboard:

Limitations
Views of the Splunk Observability Cloud service map on a dashboard are not visible in scheduled exported versions of the dashboard, such as in an email or as a PDF.
The Splunk APM service map defaults to 200 nodes, while an individual service map in Dashboard Studio defaults to its limit of 10 nodes.
| Splunk Observability Cloud metrics in Dashboard Studio | Add and format visualizations |
This documentation applies to the following versions of Splunk Cloud Platform™: 9.3.2411
 Download manual
Feedback submitted, thanks!