Understand data flow in Splunk UBA
Get data into Splunk UBA from the Splunk platform (Splunk Enterprise or Splunk Cloud Platform). Splunk UBA uses this data along with automated machine learning algorithms to generate anomalies and threats about the users, accounts, devices, and applications in your environment. Some common use cases include detecting compromised accounts and devices, detecting data exfiltration, detecting insider abuse, including privileged accounts abuse, and providing context and information for investigations.
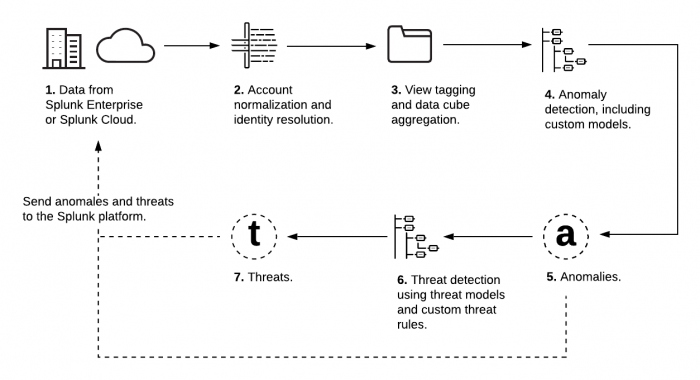
This image shows how Splunk UBA uses data from the Splunk platform to generate anomalies and threats. Splunk UBA can send these anomalies and threats back to the Splunk platform for further analysis using integrated products such as Splunk Enterprise Security. Each element in the image is described in the table immediately following the image.
| Step | Process | Description |
|---|---|---|
| 1 | Raw or Parsed Data from the Splunk platform | Splunk UBA can ingest parsed, CIM-compliant data or raw events from the Splunk platform. You must choose the proper connector type when getting data in to Splunk UBA. Use the Splunk Direct connector to parse events on the Splunk platform before ingesting them into Splunk UBA. Use the Splunk Raw Events connector to use Splunk UBA's native parsers instead of parsing the data on the Splunk platform.
|
| 2 | Account Normalization and Identity Resolution | Splunk UBA analyzes the data from the Splunk platform and maps the fields in the data to Splunk UBA-specific fields. Properly mapped data fields enables Splunk UBA to do the following:
|
| 3 | Views Specific to each Data Type | Splunk UBA provides a level of abstraction so that you only see important, relevant data. For example, firewall logs can come in a variety of formats depending on the source vendor. Splunk UBA abstracts the variety in the data and shows you only the data relevant to firewall-related activity, such as IP, port, and information about the firewall action. This metadata is tagged with an appropriate view such as Firewall and stored in data cubes.
|
| 4 | Anomaly Models | Anomaly models analyze the data in Splunk UBA and create anomalies based on a variety of factors.
You can create new batch anomaly models or clone existing models using the custom use case framework. See What is the custom use case framework? in Develop Custom Content in Splunk User Behavior Analytics.
|
| 5 | Anomalies | Anomalies are notable findings in the data, such as deviations from typical behavior or the detection of interesting patterns, like beaconing. A Splunk UBA operator can view anomalies and take further action as needed. Anomalies vary in scope and complexity, ranging from simple highlights of a useful alarm generated by an external product, such as a security endpoint solution or a firewall, to stealthy data exfiltration attempts requiring advanced statistical and machine learning models to detect. Anomalies are generated by the streaming models, batch models, and anomaly rules.
Anomalies have both types and categories. Types are specific descriptive names of anomalies, while categories are generic descriptions for anomalies. Multiple anomaly types can share a category, and one anomaly type can have multiple categories. Create an anomaly action rule or a custom threat with either anomaly types or anomaly categories, depending on how specific you want the rule or threat to be. |
| 6 | Threat Models and Custom Threat Rules | Threat models in Splunk UBA build dynamic threats based on the data and anomalies in the system. You can also create custom threat rules to identify verifiable threats in your network, like specific activities that you want to monitor for policy compliance. Create, edit, enable, and manage the custom threats that are most useful for your organization. You can create custom threats that apply to users, devices, or sessions. Several custom threats are included with Splunk UBA.
|
| 7 | Threats | A threat is a collection of one or more anomalies that form a clearly defined security use case, such as Data Exfiltration. Threats are often correlated with indicators of compromise (IoC) and other supporting evidence to provide a detailed description of a series of events. Threats can be computed in the following ways:
|
| How data gets from the Splunk platform to Splunk UBA |
This documentation applies to the following versions of Splunk® User Behavior Analytics: 5.0.0, 5.0.1, 5.0.2, 5.0.3, 5.0.4, 5.0.4.1, 5.0.5, 5.0.5.1, 5.1.0, 5.1.0.1, 5.2.0, 5.2.1, 5.3.0, 5.4.0, 5.4.1, 5.4.1.1, 5.4.2, 5.4.3

 Download manual
Feedback submitted, thanks!