When Splunk User Behavior Analytics (UBA) is deployed on Splunk Enterprise, the Splunk platform sends aggregated Usage Data to Splunk Inc. ("Splunk") to help improve UBA functionality and future releases. See How to opt in or out of sharing Usage Data for your options for sending UBA Usage Data, and for information about Usage Data in Splunk Enterprise, see Share data in Splunk Enterprise.
How to opt in or out of sharing Usage Data
Usage Data sharing is turned on by default. You can turn off Usage Data sharing from the Splunk UBA user interface (UI) or the command line interface (CLI).
Splunk UBA user interface
Complete the following steps:
- From the Splunk UBA UI select Settings and the option labeled Telemetry.
- Change the radio button selection as shown in the following image to Turn Off Sending Usage Data.
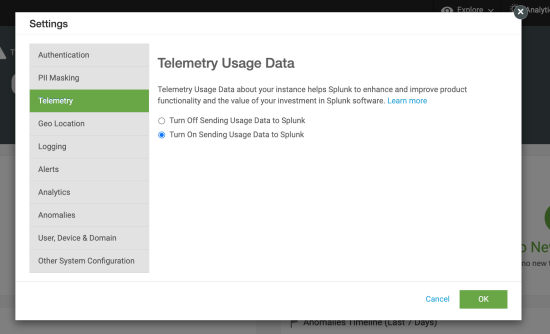
- Select OK.

Command line interface
To use the command line interface (CLI) rather than the Splunk UBA UI, follow these guidelines.
To turn off Usage Data sharing:
Execute the following command on the management node:
/opt/caspida/bin/telemetry/utils/telemetry_config.sh disable && /opt/caspida/bin/Caspida stop-splunk && /opt/caspida/bin/Caspida start-splunk
To turn on Usage Data sharing:
Execute the following command on the management node:
/opt/caspida/bin/telemetry/utils/telemetry_config.sh enable && /opt/caspida/bin/Caspida stop-splunk && /opt/caspida/bin/Caspida start-splunk
What data is collected
Splunk User Behavior Analytics (UBA) collects the following basic Usage Data:
| Component | Description | Example |
|---|---|---|
uba.telemetry.deploymentinfo
|
General information about the platform, nodes, OS, UBA version, and datasource types. | {
"component": "uba.telemetry.deploymentInfo",
"deploymentID": "548974e2-c7f8-4822-94ae-044b2e995e0c",
"executionID": "638a874e-4cc9-43ff-89b6-86fb92f717a4",
"timestamp": 1699973201,
"span": "24h",
"version": "2.0",
"data": {
"systemType": "vm",
"nodeCount": 1,
"replication": [
{
"type": "Primary",
"status": "Active"
},
{
"type": "Standby",
"status": "Active"
}
]
"ubaVersion": "5.3.0-20230810-11068359",
"osDescription": "Red Hat Enterprise Linux release 8.8 (Ootpa)",
"esIntegration": true,
"authenticationType": "UBA",
"licenseDetails": {
"licenseType": "standard",
"guid": "4007030A-DE6B-4A05-84A8-0A20F8AB193A",
"expirationTime": 99000,
"users": 1234
},
"datasources": [
{
"type": "File",
"format": "INFOBLOX",
"status": "Completed",
"stats": null,
"error": null,
"processingType": "Batch",
"connectorType": "Pull",
"forceReprocess": false,
"stoppedFor": "",
"location": null,
"valid": true
},
{
"type": "HRData",
"format": "CSV",
"status": "Completed",
"stats": null,
"error": null,
"processingType": "Batch",
"connectorType": "Pull",
"forceReprocess": false,
"stoppedFor": "",
"location": null,
"valid": true
},
{
"type": "File",
"format": "BOX/EVENTS",
"status": "Completed",
"stats": null,
"error": null,
"processingType": "Batch",
"connectorType": "Pull",
"forceReprocess": false,
"stoppedFor": "",
"location": null,
"valid": true
},
{
"type": "File",
"format": "O365/SHAREPOINT",
"status": "Completed",
"stats": null,
"error": null,
"processingType": "Batch",
"connectorType": "Pull",
"forceReprocess": false,
"stoppedFor": "",
"location": null,
"valid": true
},
{
"type": "File",
"format": "WEBLOG",
"status": "Completed",
"stats": null,
"error": null,
"processingType": "Batch",
"connectorType": "Pull",
"forceReprocess": false,
"stoppedFor": "",
"location": null,
"valid": true
},
{
"type": "File",
"format": "AD/MULTILINE",
"status": "Completed",
"stats": null,
"error": null,
"processingType": "Batch",
"connectorType": "Pull",
"forceReprocess": false,
"stoppedFor": "",
"location": null,
"valid": true
},
{
"type": "File",
"format": "AD/SNARE_FLAT",
"status": "Completed",
"stats": null,
"error": null,
"processingType": "Batch",
"connectorType": "Pull",
"forceReprocess": false,
"stoppedFor": "",
"location": null,
"valid": true
},
{
"type": "File",
"format": "BOX",
"status": "Completed",
"stats": null,
"error": null,
"processingType": "Batch",
"connectorType": "Pull",
"forceReprocess": false,
"stoppedFor": "",
"location": null,
"valid": true
},
{
"type": "File",
"format": "SYMANTECDLP/ENDPOINT",
"status": "Completed",
"stats": null,
"error": null,
"processingType": "Batch",
"connectorType": "Pull",
"forceReprocess": false,
"stoppedFor": "",
"location": null,
"valid": true
},
{
"type": "File",
"format": "CEF",
"status": "Completed",
"stats": null,
"error": null,
"processingType": "Batch",
"connectorType": "Pull",
"forceReprocess": false,
"stoppedFor": "",
"location": null,
"valid": true
},
{
"type": "File",
"format": "PAN",
"status": "Completed",
"stats": null,
"error": null,
"processingType": "Batch",
"connectorType": "Pull",
"forceReprocess": false,
"stoppedFor": "",
"location": null,
"valid": true
},
{
"type": "File",
"format": "DYNAMIC/ESRULES",
"status": "Completed",
"stats": null,
"error": null,
"processingType": "Batch",
"connectorType": "Pull",
"forceReprocess": false,
"stoppedFor": "",
"location": null,
"valid": true
},
{
"type": "File",
"format": "CISCOSA",
"status": "Completed",
"stats": null,
"error": null,
"processingType": "Batch",
"connectorType": "Pull",
"forceReprocess": false,
"stoppedFor": "",
"location": null,
"valid": true
},
{
"type": "File",
"format": "WEBGATEWAY",
"status": "Completed",
"stats": null,
"error": null,
"processingType": "Batch",
"connectorType": "Pull",
"forceReprocess": false,
"stoppedFor": "",
"location": null,
"valid": true
},
{
"type": "File",
"format": "DYNAMIC/BRIVO_BADGEACCESS",
"status": "Completed",
"stats": null,
"error": null,
"processingType": "Batch",
"connectorType": "Pull",
"forceReprocess": false,
"stoppedFor": "",
"location": null,
"valid": true
},
{
"type": "Splunk",
"format": "SPLUNK/DIRECT",
"status": "Completed",
"stats": null,
"error": null,
"processingType": "Live",
"connectorType": "Pull",
"forceReprocess": false,
"stoppedFor": null,
"location": null,
"valid": true,
"categoryIds": [
"Authentication"
]
}
],
"systemResources": {
"nodes": [
{
"cpu": {
"Architecture": "x86_64",
"CPU(s)": "16",
"Thread(s) per core": "1",
"Core(s) per socket": "1",
"Socket(s)": "16",
"Vendor ID": "GenuineIntel",
"Model name": "Intel(R) Xeon(R) Gold 5118 CPU @ 2.30GHz",
"CPU MHz": "2294.609",
"L1d cache": "32K",
"L1i cache": "32K",
"L2 cache": "1024K",
"L3 cache": "16896K"
},
"memory": 62,
"diskUsage": {
"/var/vcap": 98,
"/var/vcap2": 98
},
"id": 1,
}
]
}
}
}
|
uba.telemetry.anomalies
|
General information about detected anomalies including anomaly type, count, models triggered, and rules triggered. | {
"component": "uba.telemetry.anomalies",
"deploymentID": "548974e2-c7f8-4822-94ae-044b2e995e0c",
"executionID": "638a874e-4cc9-43ff-89b6-86fb92f717a4",
"timestamp": 1699973201,
"span": "24h",
"version": "2.0",
"data": [
{
"anomalyType": "BytesTransmitted",
"anomalyCount": 2,
"detectedByModels": [
"Timeseries_BytesOutPerDevice",
"Timeseries_BytesOutPerUser"
],
"detectedByRules": []
},
{
"anomalyType": "ShortLivedAccount",
"anomalyCount": 1,
"detectedByModels": [],
"detectedByRules": [
"account_creation_deletion_in_short_span"
]
},
{
"anomalyType": "MultipleLoginError",
"anomalyCount": 1,
"detectedByModels": [
"Timeseries_LoginCountFailures"
],
"detectedByRules": []
}
]
}
|
uba.telemetry.threats
|
General information about detected theats including threat type, count, models triggered, and rules triggered. | {
"component": "uba.telemetry.threats",
"deploymentID": "548974e2-c7f8-4822-94ae-044b2e995e0c",
"executionID": "638a874e-4cc9-43ff-89b6-86fb92f717a4",
"timestamp": 1699973201,
"span": "24h",
"version": "2.0",
"data": [
{
"threatType": "10",
"threatCount": 1,
"detectedByModels": [],
"detectedByRules": [
"1"
]
},
{
"threatType": "Data Exfiltration by Suspicious Data Transfer",
"threatCount": 1,
"detectedByModels": [
"Data Exfiltration by Suspicious Data Transfer"
],
"detectedByRules": []
}
]
}
|
uba.telemetry.uiUsage
|
General information about actions taken in the UBA user interface. | {
"component": "uba.telemetry.uiUsage",
"deploymentID": "548974e2-c7f8-4822-94ae-044b2e995e0c",
"executionID": "638a874e-4cc9-43ff-89b6-86fb92f717a4",
"timestamp": 1699973201,
"span": "24h",
"version": "2.0",
"data": [
{
"action": "View Data Source Details",
"entityType": "DataSource",
"count": 12
},
{
"action": "View Data Sources",
"entityType": "DataSource",
"count": 5
},
{
"action": "Update Data Sources",
"entityType": "DataSource",
"count": 3
},
{
"action": "Login",
"entityType": null,
"count": 2
},
{
"action": "Logout",
"entityType": null,
"count": 2
},
{
"action": "View Home",
"entityType": null,
"count": 2
},
{
"action": "Create Data Sources",
"entityType": "DataSource",
"count": 1
}
]
}
|
uba.telemetry.sizingData
|
General information including the number of monitored accounts, monitored devices, and monitored applications. | {
"component": "uba.telemetry.sizingData",
"deploymentID": "548974e2-c7f8-4822-94ae-044b2e995e0c",
"executionID": "638a874e-4cc9-43ff-89b6-86fb92f717a4",
"timestamp": 1699973201,
"span": "24h",
"version": "2.0",
"data": {
"user": 120,
"anomaly": 100,
"threat": 20,
"device": 4502620,
"app": 166,
"humanUsers": 0,
"hrDataUsers": 1136,
"hrDataAccounts": 1136
}
}
|
uba.telemetry.events
|
The number of events processed in specified time window (e.g. 1h, 24h). | {
"component": "uba.telemetry.events",
"deploymentID": "548974e2-c7f8-4822-94ae-044b2e995e0c",
"executionID": "638a874e-4cc9-43ff-89b6-86fb92f717a4",
"timestamp": 1699973201,
"span": "1h",
"version": "2.0",
"data": {
"event_count": 12344
}
}
|
uba.telemetry.eps
|
Number of events per second at different stages including data source, ETL, and IR. | {
"component": "uba.telemetry.eps",
"deploymentID": "548974e2-c7f8-4822-94ae-044b2e995e0c",
"executionID": "638a874e-4cc9-43ff-89b6-86fb92f717a4",
"timestamp": 1699973201,
"span": "1h",
"version": "2.0",
"data": {
"dataSource": 2034,
"etl": 1340,
"ir": 1000,
"streamingModels": 1370,
"overall": 1200
}
}
|
uba.telemetry.systemPerformance
|
General information including average CPU usage, memory consumption, and disk usage. | {
"deploymentID": "f30679c2-bf91-4ad7-9522-f1781fb5f8dc",
"executionID": "de4f660c-1c6f-482c-ab21-a456ec2a74a8",
"timestamp": 1709030405.9317617,
"span": "5m",
"component": "uba.telemetry.systemPerformance",
"version": "2.0",
"data": {
"nodes": [
{
"cpu": 0.03562,
"memory": 0.6493,
"diskUsage": {
"/var/vcap2": 1,
"/var/vcap": 2
},
"id": 1
},
{
"cpu": 0.03062,
"memory": 0.2293,
"diskUsage": {
"/var/vcap": 3
},
"id": 2
},
{
"cpu": 0.02438,
"memory": 0.1983,
"diskUsage": {
"/var/vcap": 2,
"/var/vcap2": 1
},
"id": 3
}
]
}
}
|
uba.telemetry.modelsPerformance
|
General information about models including name, type, enabled/ not enabled, and status. | {
"deploymentID": "a3cae954-6473-48fe-8200-ff0a965cf775",
"executionID": "8cf86c2b-c4f5-4066-a476-37f68fa6a0ce",
"timestamp": 1702392205.4355266,
"span": "24h",
"component": "uba.telemetry.modelsPerformance",
"version": "2.0",
"data": {
"name": "ExternalDestinationPopularity",
"type": "Offline",
"instanceCount": null,
"enabled": true,
"modelStats":
{
"processTime": 1702339591045,
"completedExecutions": 50,
"incompleteExecutions": 0,
"executionDuration": 28230,
"failedStages": 0,
"completedStages": 25,
"totalStages": 38,
"skippedStages": 13,
"totalTasks": 4354,
"failedTasks": 0,
"completedTasks": 3119,
"skippedTasks": 1235,
"shuffleReadBytes": 3407991,
"shuffleReadRecords": 28064,
"shuffleWriteBytes": 3393101,
"shuffleWriteRecords": 27966,
"diskBytesSpilled": 0,
"longestStageDuration": 9,
"totalJobs": 27,
"eventCount24h": 0
},
"custom": false,
"generatedAnomaliesCount": 0
}
}
{
"deploymentID": "a3cae954-6473-48fe-8200-ff0a965cf775",
"executionID": "8cf86c2b-c4f5-4066-a476-37f68fa6a0ce",
"timestamp": 1702392205.4355266,
"span": "24h",
"component": "uba.telemetry.modelsPerformance",
"version": "2.0",
"data":
{
"name": "PowershellStreamingModel",
"type": "Streaming",
"instanceCount": "1",
"enabled": true,
"modelStats":
{
"processTime": 1702379823953,
"lastTrainDuration": 0,
"lastScoreDuration": 1,
"lastEventCount": 4,
"dsStats": null,
"instanceId": null,
"lastLoadTime": 0,
"lastCommitTime": 0,
"lastCommittedModels": 4,
"avgEPS": 1876,
"lastTotalProcessDuration": 1,
"lastBatchCount": 357,
"instanceThreadIndex": null,
"lastDeserializeDuration": 0,
"numInstances": 0,
"lastModelStoreDeserDuration": 0.0,
"lastLoadedModels": 0,
"lastCreatedModels": 0,
"lastStatsWindowMins": 63,
"eps": 4000,
"processing": false,
"overallTotalProcessDuration24h": 469,
"eventCount24h": 880,
"totalTrainDuration24h": 10,
"totalScoreDuration24h": 454,
"totalDeserializeDuration24h": 10,
"totalLoadedModels24h": 0,
"totalCreatedModels24h": 4,
"totalModelStoreDeserDuration24h": 0.0
},
"custom": false,
"generatedAnomaliesCount": 0
}
}
|
What data is not collected
Splunk UBA does not collect any data that includes identifiable information such as user ID, name, email address, IP address, index name, host name, or search string.
How data is collected
Splunk UBA Usage Data gathering is performed by a collection of Python scripts. These scripts were developed by the Splunk UBA development team and orchestrated using a built-in job scheduler. This scheduler integrates with Splunk's Products Telemetry platform using the Splunk Universal Forwarder with TCP input.
Usage Data collection tasks run at defined system times depending on the type of information being collected. There are jobs implemented in Splunk UBA with a built-in scheduler that is designed to run at specified interval(s), like every 5 minutes, every hour, or every twenty-four hours.
Usage Data is collected from multiple Splunk UBA data stores including Redis, Postgres, influx, server, license, and Impala.
Usage Data is generated in the form of JSON-based Telemetry Events. These events are stored in regular log files.
Usage Data is sent to the Products Telemetry platform using TCP and a Splunk Heavy Forwarder, which is bundled with Splunk UBA distribution.
| Learn more about Splunk UBA | Third-party credits in Splunk UBA |
This documentation applies to the following versions of Splunk® User Behavior Analytics: 5.4.0, 5.4.1, 5.4.1.1, 5.4.2
Feedback submitted, thanks!