Capacity Planning Hosts
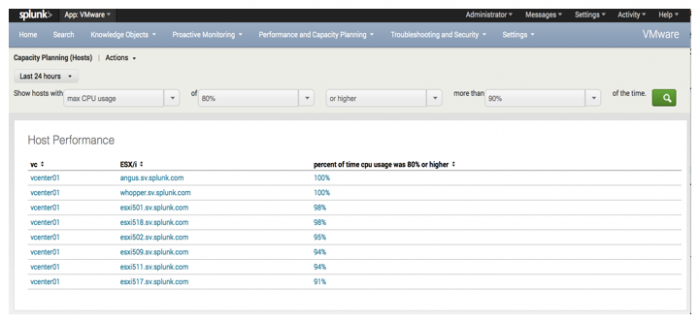
Use the Capacity Planning (Hosts) dashboard to monitor and plan the allocation of resources to hosts in your environment. This dashboard shows the performance of hosts, over time, based on the memory or cpu resources used. These resources are critical components of your virtual infrastructure.
Looking at this dashboard you can see the performance of hosts for the specific metric selected. Using the data provided you can provision your hosts and virtual machines with the correct amount of physical memory and cpu resources.
The Splunk App for VMware uses VMware's key performance counters to determine the memory and cpu resource demands of the hosts.
Host Performance
You can generate a report to monitor the performance of hosts based on cpu or memory usage. In the Capacity Planning (Hosts) dashboard create a search using the drop-down lists on the dashboard.
To show host performance:
- Select a time range for the search, for example Last 24 hours.
- In the Show Hosts with drop-down list, select a key performance metric, max cpu usage or max memory usage, on which to base the search. For example, max cpu usage.
- Define a usage percent for a resource, for example 70%.
- Specify whether you want the search to include results that are higher or lower that the percent specified (in the next step). In this example select "or higher".
- Define a percentage of time over which the resource is used, for example 5%.
A results table shows host performance for all hosts for which max_cpu_usage was 70% or higher more than 5% of the time.
Chart host performance
Click on a host in the results table to chart the individual host performance. The average and maximum usage for the performance category (mem or cpu) for the host is displayed in relation to the threshold you defined.
Metrics used to populate the dashboard
| Name | Metric | Description |
|---|---|---|
| max cpu usage | p_average_cpu_usage_percent | This is the virtual machine's average memory usage as a percent value. |
| max memory usage | p_average_mem_usage_percent | This is the virtual machine's average memory usage as a percent value. |
Searches that populate the dashboard
The following searches are used to populate the Capactity Planning (Hosts) dashboard:
- d_capacity_planning_hosts_list_usage_cpu
- d_capacity_planning_hosts_list_usage_mem
| Performance of Hosts and VMs | Capacity Planning Clusters |
This documentation applies to the following versions of Splunk® App for VMware (EOL): 3.4.1, 3.4.2, 3.4.3, 3.4.4, 3.4.5, 3.4.7

 Download manual
Feedback submitted, thanks!