Configure correlation searches
Correlation searches generate notable events, which are displayed in the different views and dashboards of the Splunk App for PCI Compliance. Notable events can be configured by modifying their associated correlation searches. To inspect or change a correlation search (to modify a notable event), click Correlation Searches in the Configuration panel (Configure > Incident Management > Correlation Searches).

Enable correlation searches
The correlation searches used by the Splunk App for PCI Compliance are disabled by default. For details about the correlation searches shipped with the Splunk App for PCI Compliance, see "Search View Matrix" in the Splunk App for PCI Compliance User Manual.
To enable correlation searches in your deployment:
1. Go to Configure > Incident Management > Correlation Searches to see the list of correlation searches.

2. Find the name of the correlation search you want to enable. Do not click the name.
3. Click Enable in the Status column next to the correlation search name.
4. Click "Back to PCI Compliance" in the menu bar to return to the app.
Correlation Search editor
Use the Correlation Search editor to create or modify correlation searches used by the Splunk App for PCI Compliance. Options for configuration are:
- Edit correlation search thresholds
- Edit correlation search severity
- Set up correlation search governance
- Disable correlation searches: If you are not interested in a particular group of notable events, you can disable their correlation searches. For example, if you are not bringing in any malware data, disable the malware-related correlation searches. Additionally, disabling correlation searches reduces resource utilization of Splunk Enterprise.
- Edit correlation searches
- Filter notable events
- Create correlation searches
To open the editor, do the following:
1. Go to Configure > Incident Management > Correlation Searches.
2. Click a search name or click New.


Do not include any summary indexes when adding indexes to the default search indexes because this can cause a search and summary index loop. See the PCI Compliance User Guide FAQ for more details.
This table describes the fields that you can modify in the Correlation Search editor.
| Field | Description |
|---|---|
| Correlation Search Name | Name of the correlation search. |
| Domain | Domain that is searched. |
| Application Context | Context for the search (for example, Access Protection). |
| Correlation Search Description (optional) | What the search does. |
| Search | Raw search string associated with this correlation search. |
| Time range (optional) | Start time and Finish time. |
| Search Type | Cron schedule. |
| Attributes | |
| Rule Title | This is displayed. |
| Rule Description | This is displayed. |
| Severity | Informational, low, medium, high, critical. |
| Default Status | Set by system. |
| Default Owner | Set by system. |
| Drill-down Name | This is displayed. |
| Drill-down Search | This is displayed. |
| Alert Actions | Sent email, Add to RSS, Run a script, Tracking. |
| Throttling | Duration of throttling of events. |
| Fields to Group by |
Modify correlation searches
The default correlation searches can support a range of environments and purposes. You can modify the searches, for example, to restrict them to look at a subset of the data (for example, if you want the correlation search to function for your web servers, a particular business unit, and so on).
The correlation search can be edited by changing the saved search associated with it.
1. Go to Configure > Incident Management > Correlation Searches.
2. Select the correlation search to edit. The Correlation Search editor for the given correlation search is displayed.
3. Copy the text in the search entry box, then click Back to PCI Compliance and navigate to the Search dashboard. Then, paste the search in the search bar.
4. Formulate the search according to your requirements.
For example, to edit the Network - Policy Or Configuration Change correlation search to trigger only when the host starts with "ACME", add "dvc=ACME*" to the search:

5. Click the search button (![]() ) to run the search and ensure the results are as expected.
) to run the search and ensure the results are as expected.
6. Copy the correctly modified search string. Copy it to a text editor to ensure that you have it available.
7. Return to Configure > Correlation Searches and select your search again.
8. Paste the updated search into the search entry box or type in the appropriate modifications.
9. Click Save.
When you modify correlation searches, make sure you do not alter certain statements that are required for the search to run properly:
- Do not remove the
get_assetorget_rule_uidmacros. These macros retrieve the asset information and generate a unique identifier for the event respectively.
- Do not change the start time, end time, or frequency of the correlation searches. Some correlation searches rely on summary indexes that you must modify if the search frequency is changed. Changing the saved search frequency without changing the associated summary index might cause the correlation search to be out-of-sync and provide incorrect results.
Configure correlation search severity
1. Go to Configure > Incident Management > Correlation Searches to see a list of all current correlation searches that are generating notable events.
2. Click the name of the correlation search to configure. The Correlation Search editor opens.
3. In the Severity field of the editor, change the severity to the desired level. Allowed values are informational, low, medium, high, and critical.
4. Click Save.
Drill down
Correlation searches create notable events. A notable event can be associated with one or many raw events. The drill-down search feature of the Correlation Search editor allows an administrator to define the search used to follow this association, as well as the textual link that is presented to PCI compliance analysts reviewing notable events under the Contributing Events heading.
There are two fields in a correlation search to consider for notable events. The Drill-down Name field defines the textual link that is presented to Security Analysts reviewing notable events. You can use tags to provide expandable context, such as host names and addresses.
For example, in the High Or Critical Priority Host With Malware Detected correlation search this field is set to "View infections on $dest$".
The Drill-down Search field defines the search that is used to find associated raw events. For example, in the same correlation search this field is set to tag=malware tag=attack dest=$dest$. Security Analysts who view a notable event generated by this correlation search in relation to a destination 192.168.1.1 see a Contributing Events link "View infections on 192.168.1.1".
Alert actions for correlation search
You can set up alert actions or notifications using the correlation search editor. When conditions specified as part of the correlation search occur, an alert action can be generated. Select one or more of these alert options in this section of the correlation search editor:
- generate an email
- send an RSS feed
- run a script
- turn on tracking
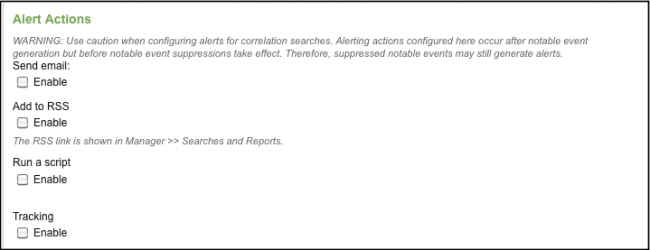

Note: Alerting actions configured for notable events occur after the notable event generation, but before notable event suppressions take place. Because of this, suppressed notable events might still generate alerts.
Throttling window duration
To set a window duration during which matching events do not fire, do the following:
1. Go to Configuration > Correlation Searches > <$search_name$> > Throttling.
2. Set the time span in the Window Duration field.
For example, there can be a scheduled search with an overlapping window (runs every 5 minutes and looks at a 10 minute window). If this search detects a simple condition in an event, it re-detects that same event and generate a second notable event unless the Throttle is set.
Throttling fields to group by
Set a collection of fields to group by to determine if the same event is being detected.
1. Go to Configuration > Correlation Searches > <$search_name$> > Throttling.
2. Add the field names in Fields to group by.
For example, there can be a more complex search that looks at 10 raw events to determine if there is a notable event. The field names entered in this field must match before a second notable event is generated.
Add the edit_correlationsearches capablity
To change the role-based permissions (what groups are permitted to edit a specific correlation search or all correlation searches in a particular app), edit the local.meta file on the filesystem of the system hosting the Splunk App for PCI Compliance. App object permissions are stored in the local.meta or default.meta files.
You can permit users in a non-administrative role to edit correlation searches.
1. Add the "edit_correlationsearches" capability to the role you want to grant editing rights. For example, add permissions to the "pci_analyst" role (included by default in the Splunk App for PCI Compliance).
- a. Go to Manager > Access controls > Roles > pci-analyst. Click the "pci_analyst" role and the role editor appears.
- b. Scroll down to Capabilities and add "edit_correlationsearches".

- c. Click Save.
2. Modify the local.meta file to grant the role permissions in each app that you want to permit the role to edit correlation searches.
- a. Add the new role permissions to the
DA-PCIRequirement8app. In a text editor, open the$SPLUNK_HOME/etc/apps/DA-PCI-Requirement8/metadata/local.metafile.
- b. Add or modify the
aggregate,savedsearches, andcorrelationsearchesstanzas to include write permissions for the additional role. The portion of the file that contains these three stanzas should look like this:
## To allow additional roles to manage correlation searches, append to the write list like so
## access = read : [ * ], write : [ admin,role2,role3 ]
  [savedsearches]
  access = read : [ * ], write : [ admin,pci_analyst ]
  [aggregate]
  access = read : [ * ], write : [ admin,pci_analyst ]
  [correlationsearches]
  access = read : [ * ], write : [ admin,pci_analyst ]
- c. Save the
local.metafile.
- d. Restart Splunk Enterprise to refresh the
aggregate,correlationsearches, andsavedsearchesREST endpoints.
Change time window for notable event drill-down
You can modify the time window for the drill-down link on notable events. This link shows all raw events associated with the notable event.
By default, drill-down from a notable event displays the status of the related events at the time you drill down, not just the events that occurred before the notable event was detected. In particular, drilling down from a notable event might reveal more events than the count field in the notable indicates.
For example, a particular notable event can be created as soon as 100 authentication failures occur. However, by the time you drill down, you might see 200 authentication failures, 100 of which occurred after the initial creation of the event.
Modify the drill-down-related fields for the correlation search that defines the notable event. These fields define and name the search that is executed when the user clicks the drill-down link.
To edit the search:
1. Go to Configure > Correlation Searches.
2. Click the name of the search whose drill-down behavior you want to change.

3. Locate Add fields near the bottom of the window.

4. To change the time window of the search, edit the drill-down_search field. For example, here is the default drill-down_search field for a correlation search:
src=$src$ `authentication`
To modify this to show only the events from the last 24 hours, you would add the following:
src=$src$ `authentication` earliest=-24h
5. To change the description that appears on the Incident Review dashboard, edit the drill-down_name field. For example, here is the default description for the above drill down:
View all login attempts by $src$
Edit it to reflect the selected time window:
View all login attempts by $src$ within the last 24 hours
You can also edit the search directly in the configuration file. In this case, you modify the values for the following fields:
action.summary_index.drilldown_search: sets the search string used for the drill-down
action.summary_index.drilldown_name:sets the description displayed on the Incident Review dashboard.
See "Create a correlation search" for more information about using the configuration files for correlation searches.
| IDS/IPS Alert Activity | Create new correlation searches |
This documentation applies to the following versions of Splunk® App for PCI Compliance: 2.1.1
Feedback submitted, thanks!