Primary Functions
This report looks at cardholder systems that have multiple primary functions active. The data in the Primary Functions report is generated from a lookup file (assets.csv) populated by the user. This report looks at process data, service data, and port/protocol data to determine what functions are running on a system and displays them in the result. Use this report to identify systems where multiple primary functions might be running or where unexpected services could be in use.
Systems within the PCI cardholder environment should be implemented with only a single primary function to prevent functions that require different security levels from co-existing on the same server. The PCI requirement ensures that your system configuration standards and related processes minimize the potential for introducing security weaknesses to the system.
Relevant data sources
Relevant data sources for this report include Service, Process, and Port data (linux_base, Splunk_TA_windows).
How to configure this report
1. Index process, service, and/or port data in Splunk Enterprise.
2. Map the data to the following Common Information Model fields:
- Services fields:
dest, app, StartMode - Process fields:
dest, app, PercentProcessorTime, UsedMBytes - Port fields:
dest,dest_port,transport
Note: *_base/TA-nix and Splunk_TA_Windows do this already.
3. Configure the Primary Functions list with the functions desired
- What processes, services, or ports define a primary function?
- Is there a software stack (DB + web server) that makes up a function?
Report description
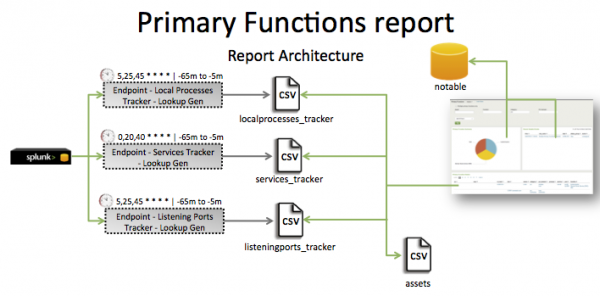
The data in the Primary Functions report is populated by three services_tracker lookups. One lookup is generated by the Endpoint - Local Processes - Lookup Gen saved search, a second by the Endpoint - Services Tracker - Lookup Gen saved search, and the third by the Endpoint - Listening Ports Tracker- Lookup Gen saved search. The localprocesses_tracker, services_tracker macros correlate process data with the asset and identity tables to pull in additional information.
This report includes three searches: Endpoint - Local Processes - Lookup Gen, Endpoint - Services Tracker - Lookup Gen, and Endpoint - Listening Ports Tracker- Lookup Gen.
The Endpoint - Local Processes - Lookup Gen search runs on an offset 20 minute cycle and looks at 60 minutes of data.
| Schedule | 5,25,45 * * * * | Runs on a 20 minute offset window. |
| Report window | -65m@m to -5m@m | Looks at 60 minutes of data. |
The Endpoint - Services Tracker - Lookup Gen search runs on an offset 20 minute schedule and looks at 60 minutes of data.
| Schedule | 0,20,40 * * * * | Runs on a 20 minute offset window. |
| Report window | -65m@m to -5m@m | Looks at 60 minutes of data. |
The Endpoint - Listening Ports Tracker- Lookup Gen runs on an 20 offset minute cycle and looks at 60 minutes of data.
| Schedule | 5,25,45 * * * * | Runs on a 20 minute offset window. |
| Report window | -65m@m to -5m@m | Looks at 60 minutes of data. |
See the Report Architecture graphic for details.
Note: The report window stops at 5 minutes ago because some data sources may not have provided complete data in a more recent time frame.
The primary functions list can be found at Configure> Lists and Lookups > Primary Functions. The primary functions CSV can be found at $SPLUNK_HOME/.
Useful searchesTroubleshooting
| Troubleshooting Task | Search/Action | Expected Result |
|---|---|---|
| Verify that service, process, and/or port information has been indexed. | sourcetype=<expected_st> | Returns data from your expected source type . |
| Verify that the service data has been normalized at search time correctly. | sourcetype=“*Service” | table dest, app, StartMode or `service` | table dest, app, StartMode |
Returns a table of service data. |
| Verify that the process data has been normalized at search time correctly. | sourcetype="*:LocalProcesses“ | table dest, app, PercentProcessorTime, UsedMBytes | Returns a table of process data. |
| Verify that the port data has been normalized at search time correctly. | | tag=listening tag=port | table dest,dest_port,transport or `listeningports` | table dest,dest_port,transport |
Returns a table of port data. |
| Verify that the service tracker file is getting created correctly. | | inputlookup append=T services_tracker or | `services_tracker` |
Returns data in the services tracker file. |
| Verify that the process tracker file is getting created correctly. | | inputlookup append=T services_tracker or | `localprocesses_tracker` |
Returns data in the process tracker file. |
| Verify that the port tracker file is getting created correctly. | | inputlookup append=T localprocesses_tracker or | `listeningports_tracker` |
Returns data in the port tracker file. |
| Verify that the primary functions tracker is created correctly. | `primary_functions_tracker` | Returns data in the primary functions tracker. |
Additional information
This report uses default source types that ship with windows TA + linux_base deployment package.
Tracker files for this report are located:
$SPLUNK_HOME/etc/apps/SA-EndpointProtection/lookups/listeningports_tracker.csv$SPLUNK_HOME/etc/apps/SA-EndpointProtection/lookups/services_tracker.csv$SPLUNK_HOME/etc/apps/SA-EndpointProtection/lookups/localprocesses_tracker.csv
| PCI System Inventory | Prohibited Services |
This documentation applies to the following versions of Splunk® App for PCI Compliance: 2.1.1

 Download manual
Feedback submitted, thanks!